
Figure 3.
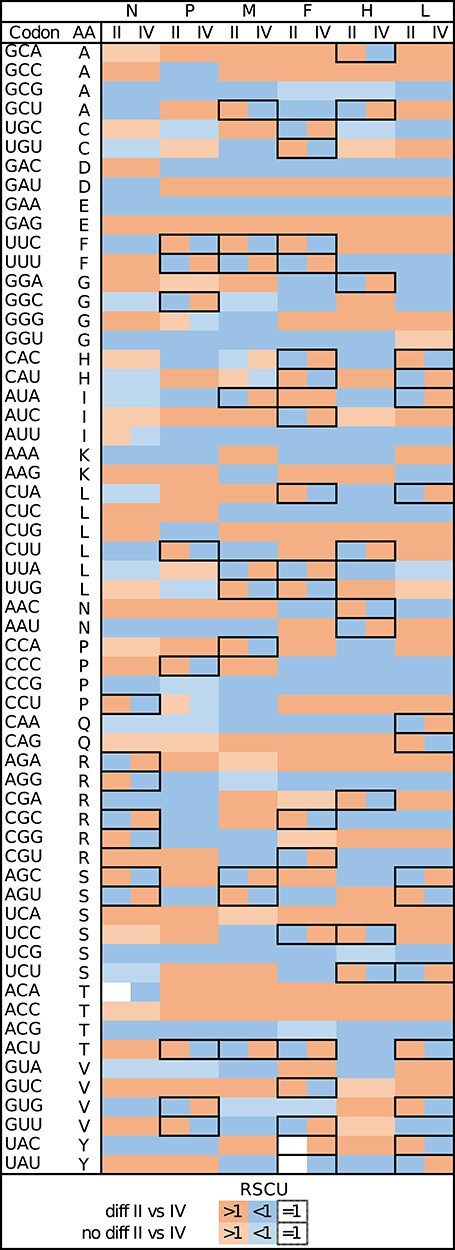
Heatmap of RSCU showing codons used more (>1) or less (<1) than expected in PPRV genes in LII and LIV. Codons with RSCU which significantly differ between lineages (P < 0.05, after correction) are in darker shades of colour. Cases of codons used more than expected for one lineage but used less for another are framed.