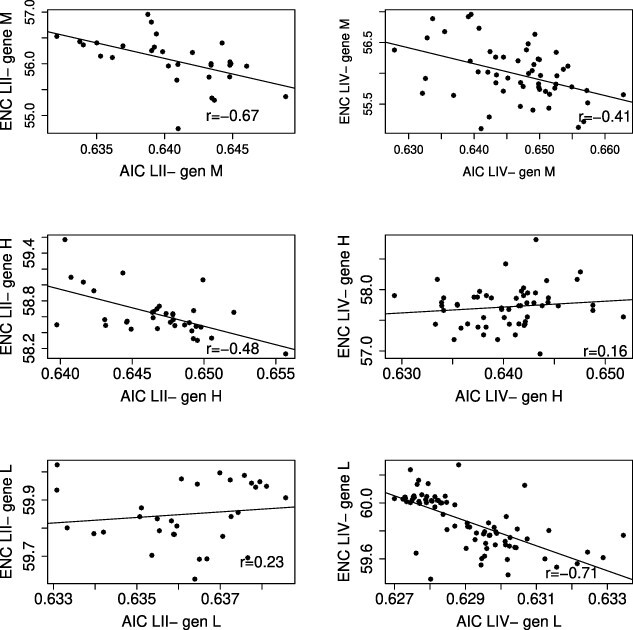
Figure 5.

Pearson’s r correlation between CAI and ENC for Genes M, H, and L of PPRV strains belonging to LII (left column) and LIV (right column). All correlation results are detailed in Table 4.

Pearson’s r correlation between CAI and ENC for Genes M, H, and L of PPRV strains belonging to LII (left column) and LIV (right column). All correlation results are detailed in Table 4.