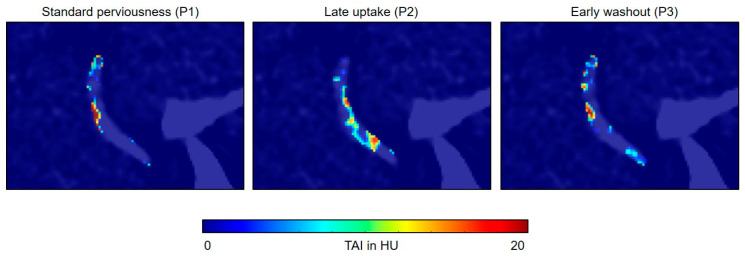
Figure 2.
Example maps of standard perviousness (P1 = CTA − NCCT), late contrast uptake (P2 = CTV − CTA), and early contrast washout (P3 = CTA − CTV) for the clot shown in Figure 1 overlaid on the NCCT image. Voxels with negative values in P1, P2, and P3 were set to zero to contain information only about the standard perviousness, late uptake, and early washout components of the clot, respectively. Maps show sub-regional differences of the measured quantities for the clot volume. For example on P2, it is visually apparent that there is a thin area through the length of the clot in which contrast agent uptake increased after CTA while the rest of the clot showed no contrast agent uptake increase.

