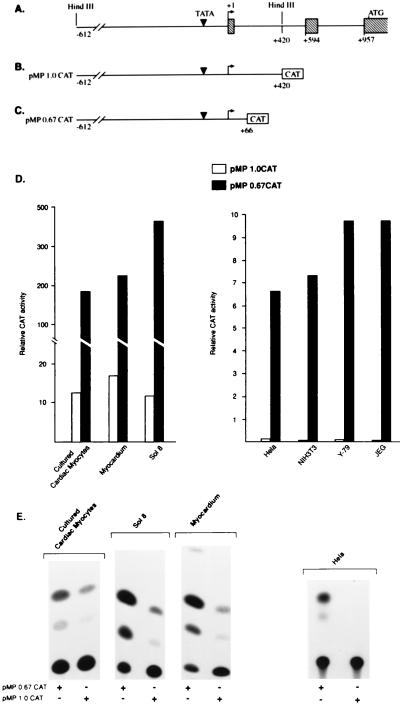
FIG. 1.
Sequences of the first intronic region control tissue-restricted expression of the α-MHC gene. (A) Schematic representation of the α-MHC gene; the shaded boxes show the positions of exons. (B and C) Configuration of plasmids MP1.0CAT and MP0.67CAT. (D) Expression of the CAT reporter gene from both plasmids after transfection in different cell types or after direct injection of DNA into the myocardium. Relative CAT activities were measured by taking plasmids RSV.CAT and CMV.β-gal as positive controls in cultured cells and in the myocardium, respectively. Bars represent mean values of five separate experiments. (E) Representative CAT assays normalized with β-galactosidase activity in the same cell lysate.

