FIG. 1.
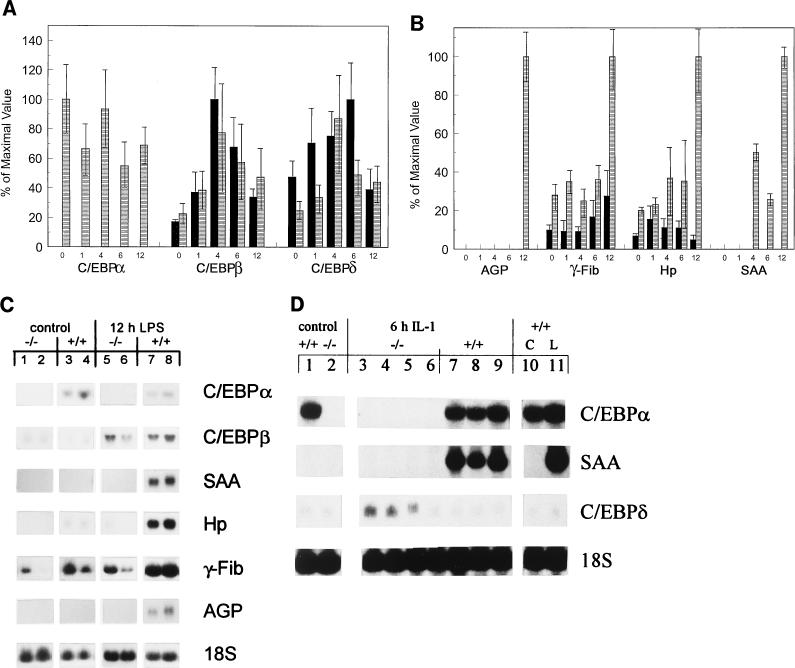
Lack of APP gene induction in C/EBPα−/− mice in response to LPS or IL-1. Northern analysis of 25 μg of total RNA from newborn C/EBPα−/− (−/−) and C/EBPα+/+ (+/+) mice at 0, 1, 4, 6, and 12 h post-LPS treatment. (A and B) Expression of C/EBP gene family (A) and APP genes (B). Blots were quantified, and the phosphorimaging value of each probe was normalized to the value of the 18S rRNA probe used as a loading control. The mean value for each genotype at each time point was determined. The largest normalized value for a given gene probe was set at 100%, and the normalized values of the other samples were compared to this maximal value. For each probe (indicated below the appropriate LPS time course), the data was expressed as the percentage of the maximal value ± standard deviation obtained for that probe. Each bar represents the results for three animals, except those for null and wild-type mice at 12 h post-LPS treatment (n = 5 and 4, respectively) and for null mice at 1 h post-LPS treatment (n = 4). ■, null mice; ▤, wild-type mice. (C) Representative Northern blots showing results for RNA from the same blot for two control (glucose-treated) −/− (lanes 1 and 2) and +/+ (lanes 3 and 4) pups and for RNA from the same blot for two −/− (lanes 5 and 6) and +/+ (lanes 7 and 8) mice at 12 h post-LPS treatment. The blots were hybridized with each individual probe sequentially, with the probe used indicated to the right of the panel. (D) Northern blot results for 25 μg of total liver RNA from control (glucose-treated) −/− (lane 2) and +/+ (lane 1) mice, 6-h-IL-1-treated −/− (lanes 3 to 6) and +/+ (lanes 7 to 9) animals, and +/+ control (C) (lane 10) and 6-h-LPS-treated (L) (lane 11) mice, hybridized sequentially with the probes indicated to the right of the panel.

