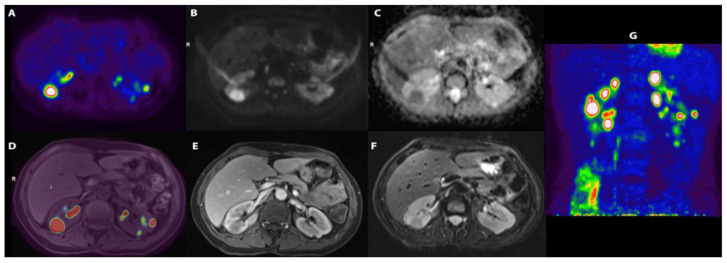
Figure 1.
(A) [18F]-FDG transaxial image demonstrating a number of areas of uptake of the tracer; (B) DWI-b1000 (high. Res. Resolve) and (C) transaxial DWI-ADC (high. Res. Resolve) showing corresponding areas of restriction of diffusivity; (D) [18F]-FDG and T1 vibe fused images; (E) transaxial T1 vibe after contrast enhancement not showing significative enhancement; (F) transaxial T2 TSE; (G) [18F]-FDG maximum intensity projection (MIP) showing a number of lesions with high uptake of the tracers in kidneys.

