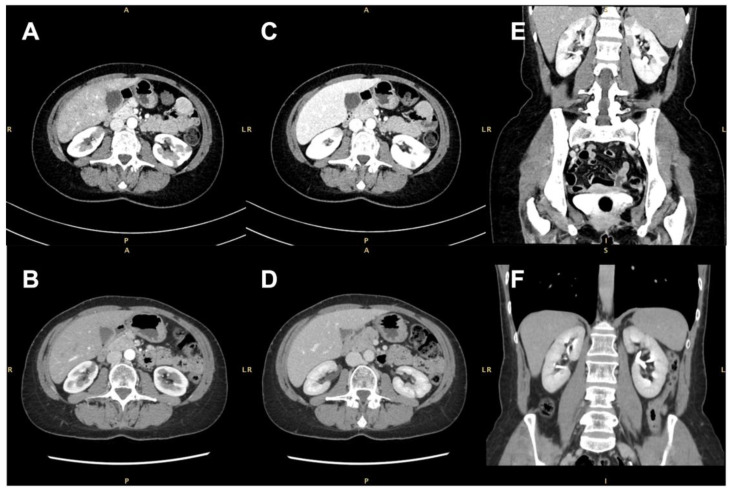
Figure 2.
Contrast-enhanced computed tomographic (CT) scan showing several bilateral renal hypovascular nodular areas (arrows). (A,B) Axial arterial phase at diagnosis and 7 months after treatment with rituximab; (C,D) axial early-venous phase at diagnosis and 7 months after treatment with rituximab; (E,F) coronal portal-venous phase at diagnosis and 7 months after rituximab therapy.

