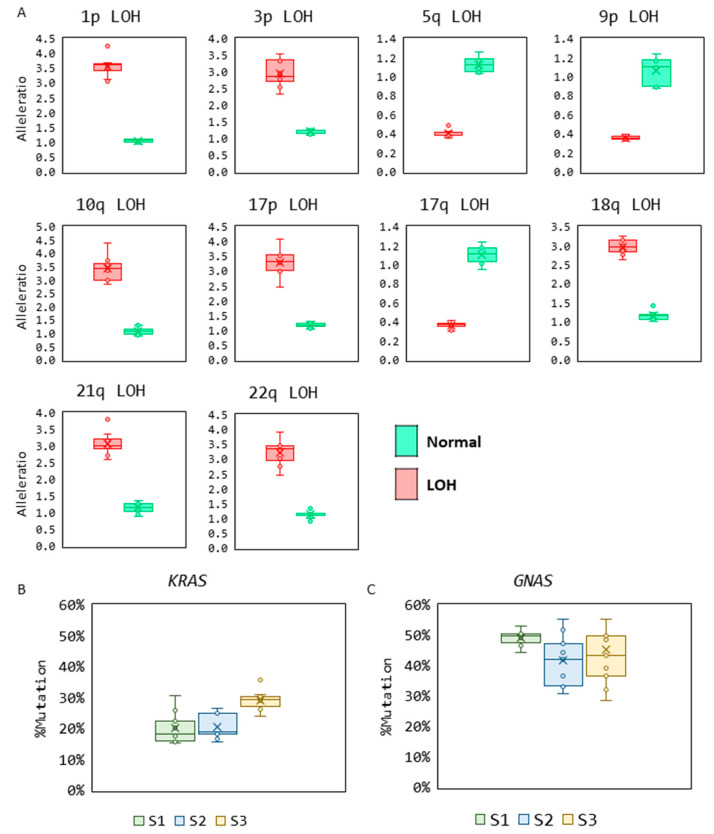
Figure 6.
(A) Reproducibility of LOH and mutation detection. (A) Box and whisker plots show allele ratios and LOH detection at 10 genomic loci for paired samples—normal (green) and LOH sample (red) (n = 8). (B) Box and whisker plots show the reproducibility in measurements of % mutation in the KRAS mutant samples (n = 9). (C) Box and whisker plots show the reproducibility in measurements of % mutation in the GNAS mutant samples (n = 9).

