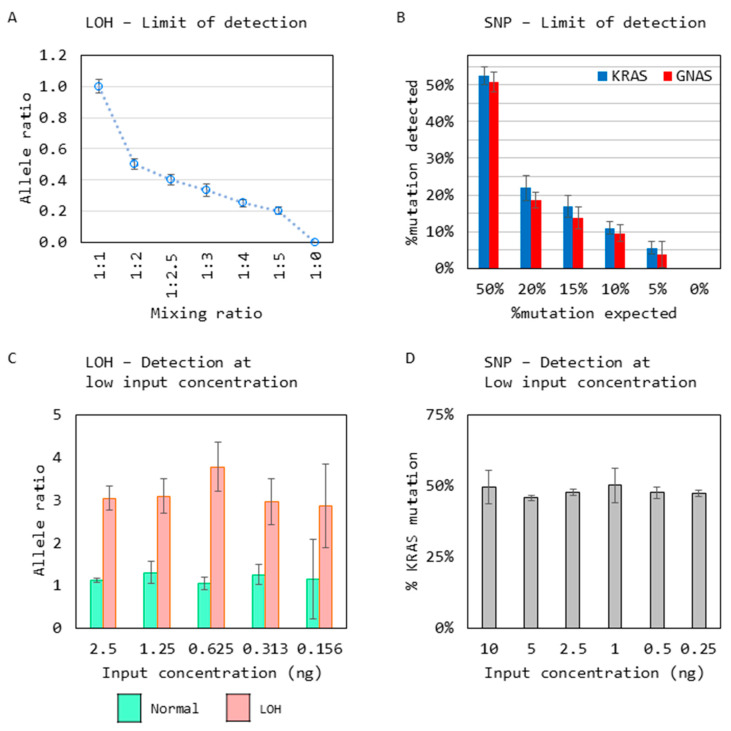
Figure 7.
Limit of detection analysis for (A) shows a change in allelic imbalance detected by analyzing mixed samples with an increasing allelic imbalance at the D5S615 STR region (n = 23). (B) KRAS and GNAS mutations were detected reliably at 10% VAF when samples positive for KRAS and GNAS mutations, respectively, were mixed into a negative sample to create samples ranging from 50% to 5% VAF and tested along with a negative sample (n = 21). (C) Reliable detection of the LOH at low-input concentrations (n = 8). (D) Reliable detection of mutations at low-input concentrations (n = 5). All graphs show the mean ± SD from replicates.

