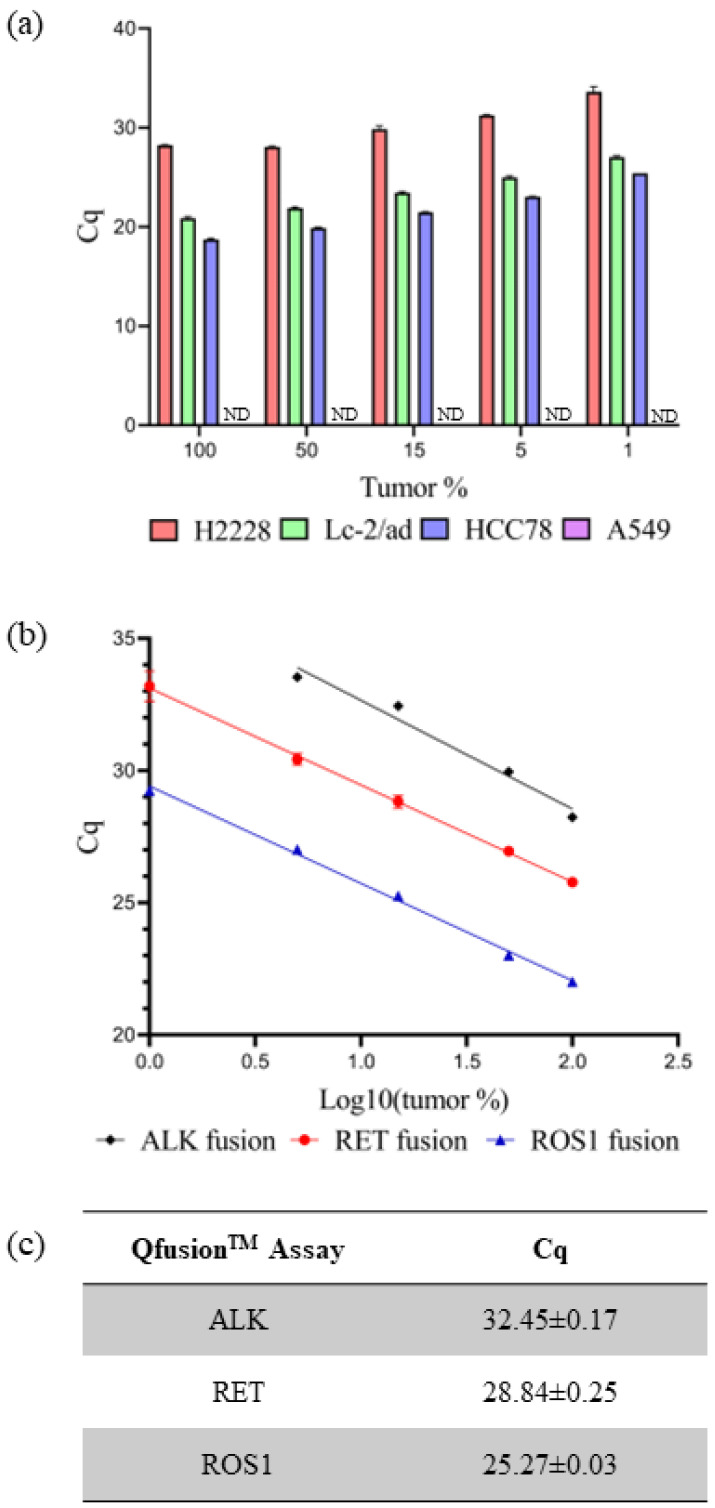
Figure 2.
Evaluating QfusionTM assay performance. (a) Each QfusionTM assay was tested with the corresponding cell lines: A549, H2228 (EML4-ALK), LC-2/ad (CCDC6-RET), and HCC78 (SLC45A-ROS1). The A549 was a fusion-negative cell line and Cq was not determined (ND). (b,c) FFPE RNA reference standard was diluted with normal FFPE RNA and analyzed with each QfusionTM assay. The x-axis represents the logarithm base 10 value of tumor percentage. Cq values were determined for 15% of tumor samples.

