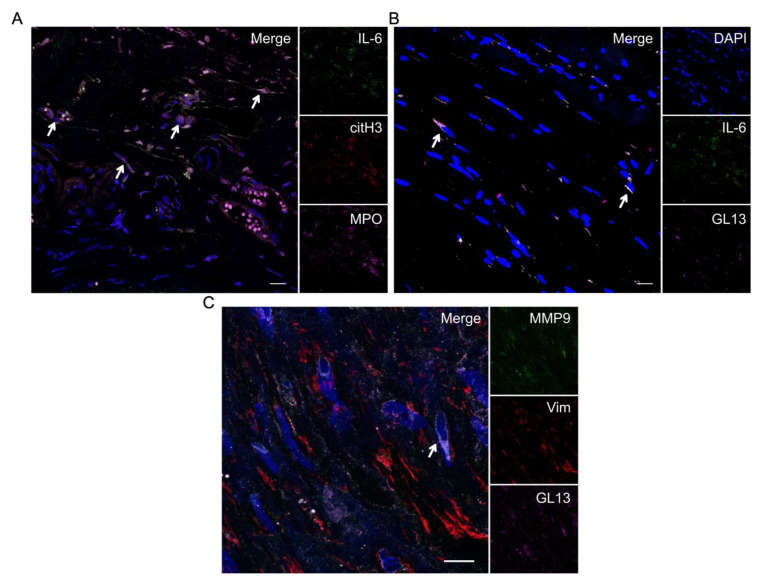
Figure 4.
(A) Representative picture of IL-6+ NETs in the TABs from GCA patients [151]. White arrows indicate the co-staining of MPO/citH3/IL-6. (B) Representative picture of senescent cells positive for IL-6 in the TABs from GCA. White arrows indicate the co-staining of GL13/IL-6. (C) Representative picture of senescent cells positive for MMP-9 in the TABs from GCA [188]. White arrows indicate co-staining of MMP-9/GL13. Blue: DAPI; green: (A) + (B) IL-6, (C) MMP9; red: (A) citrullinated H3, (C) vimentin; magenta: (A) MPO, (B) + (C) GL13/lipofuscin. Objective (A) + (B) 20×, (C) 40×. Scale bar: 25 μm.

