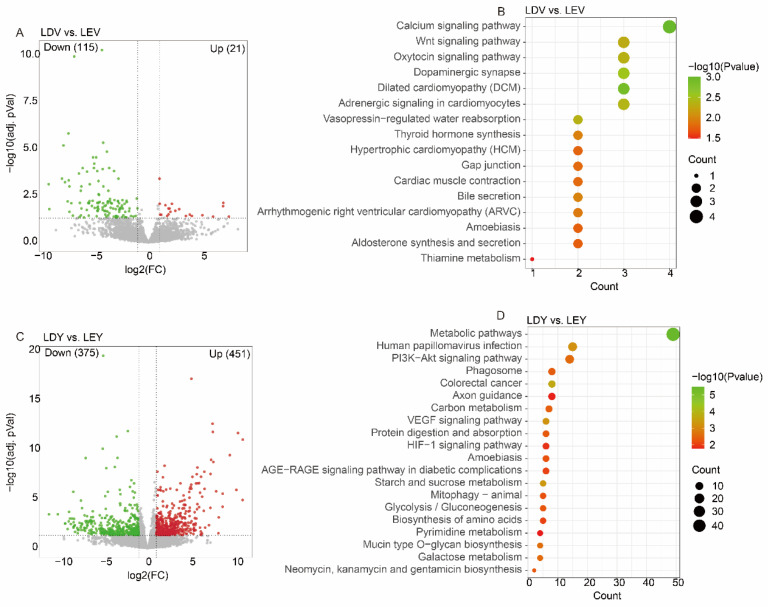
Figure 1.
Analysis of differentially expressed genes in Large White gilts. (A) A volcano plot displays differentially expressed genes in the LDV (vulva samples of Large White gilts at Diestrus stage) vs. LEV (vulva samples of Large White gilts at Estrus stage) comparison, with significance thresholds set at FPKM > 1, adjusted p-value < 0.05 and |log2 (fold change)| > 1. (B) KEGG enrichment analysis of differentially expressed genes in the LDV vs. LEV comparison. (C) A volcano plot displays differentially expressed genes in the LDY (vagina samples of Large White gilts at Diestrus stage) vs. LEY (vagina samples of Large White gilts at Estrus stage) comparison, with significance thresholds set at FPKM > 1, adjusted p-value < 0.05 and |log2 (fold change)| > 1. (D) KEGG enrichment analysis of differentially expressed genes in the LDY vs. LEY comparison.

