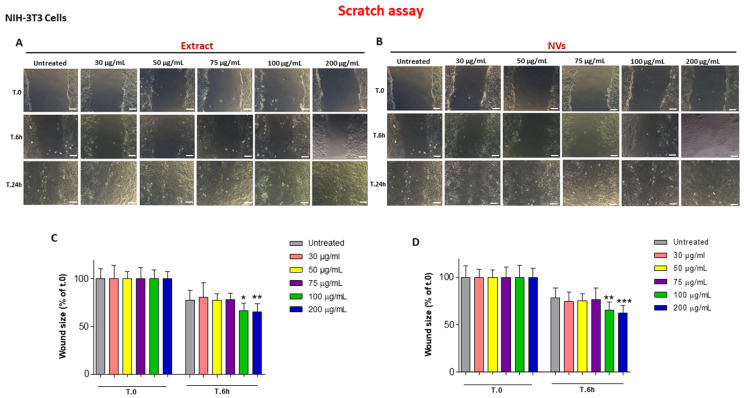
Figure 3.
Wound closure with NIH-3T3 cells. (A,B) Images of NIH-3T3 monolayers at 0, 6 h, 24 h, and 48 h after the injury and the treatment with different concentrations (30–200 µg/mL) of the Extract (A) or NVs (B). Images of untreated are the same for A and B. Bar = 100 µm. (C,D) Percentages of wound size at different time points calculated relative to the percentage of the wound area at t.0 are considered 100%. The results are represented as mean ± SD of three experiments. * p < 0.05; ** p < 0.01; *** p < 0.0001 as compared to respective controls.

