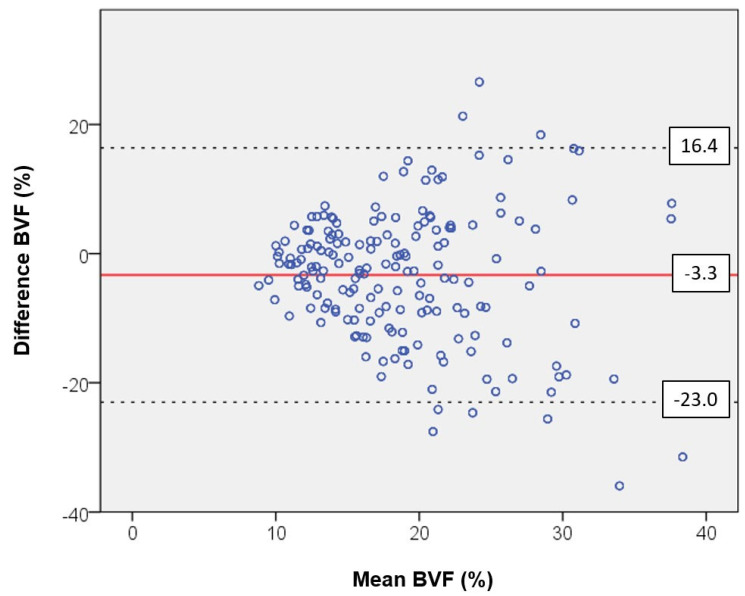
Figure 5.
Bland–Altman plot showing the differences between the ventrodorsal and craniocaudal measurements for the bone volume fraction (BVF) as a function of the mean value. The bias of −3.3 is at a low level. The scatter analysis shows no random scattering of the data around the mean value. Instead, there is a professional bias in the form of a funneling of the data, which produces comparable values at a low BVF but strongly deviating values at a higher BVF. The 95% confidence interval indicates the limits of agreement. It is decisive for the fluctuation range of the differences.

