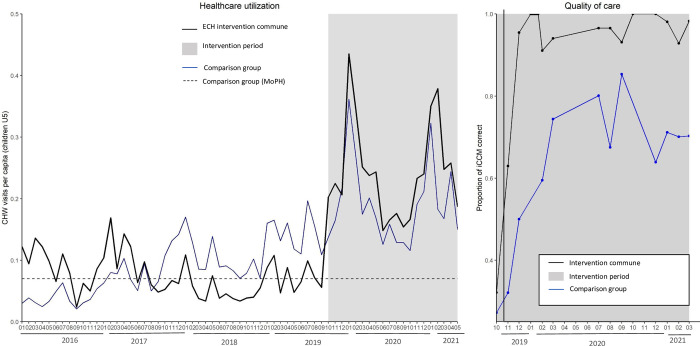
Fig 1.
Average monthly per capita utilization by children under-five of CHWs by intervention group from January 2016 to March 2020 (left). A comparison of correct care (right), measured through direct observation of the CHW during an iCCM, in the intervention commune (black) and comparison communes receiving enhanced standard of care (blue) from October 2019 to March 2020.

