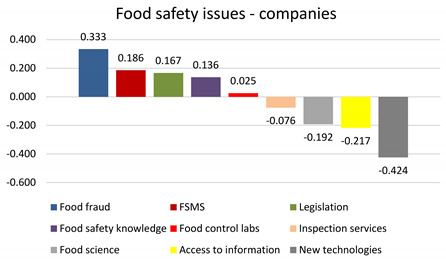
Table 4.
Subjective priority of food safety issues rated by food companies: best–worst scaling report—frequency counts and standardized average scores (N = 66).
| Attributes | Distribution [%] | Share of Preference [%] | |||
|---|---|---|---|---|---|
| Most Important | Least Important | Not Chosen | |||
| Food fraud | 49.49% | 16.16% | 34.34% | 21.21% |

|
| FSMS | 32.95% | 14.39% | 52.65% | 18.83% | |
| Legislation | 28.28% | 11.62% | 60.10% | 12.12% | |
| Food safety knowledge | 30.30% | 16.67% | 53.03% | 12.99% | |
| Food control labs | 17.68% | 15.15% | 67.17% | 7.58% | |
| Inspection services | 22.73% | 30.30% | 46.97% | 9.74% | |
| Food science | 12.12% | 31.31% | 56.57% | 5.19% | |
| Access to information | 18.18% | 39.90% | 41.92% | 7.79% | |
| New technologies | 10.61% | 53.03% | 36.36% | 4.55% | |
