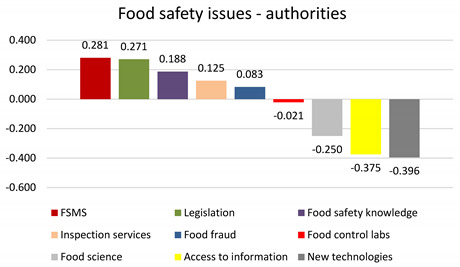
Table 5.
Subjective priority of food safety issues rated by food authorities: best–worst scaling report—frequency counts and standardized average scores (N = 16).
| Attributes | Distribution [%] | Share of Preference [%] | |||
|---|---|---|---|---|---|
| Most Important | Least Important | Not Chosen | |||
| FSMS | 35.94% | 7.81% | 56.25% | 20.54% |

|
| Legislation | 41.67% | 14.58% | 43.75% | 17.86% | |
| Food safety knowledge | 43.75% | 25.00% | 31.25% | 18.75% | |
| Inspection services | 22.92% | 10.42% | 66.67% | 9.82% | |
| Food fraud | 33.33% | 25.00% | 41.67% | 14.29% | |
| Food control labs | 16.67% | 18.75% | 64.58% | 7.14% | |
| Food science | 6.25% | 31.25% | 62.50% | 2.68% | |
| Access to information | 18.75% | 56.25% | 25.00% | 8.04% | |
| New technologies | 2.08% | 41.67% | 56.25% | 0.89% | |
