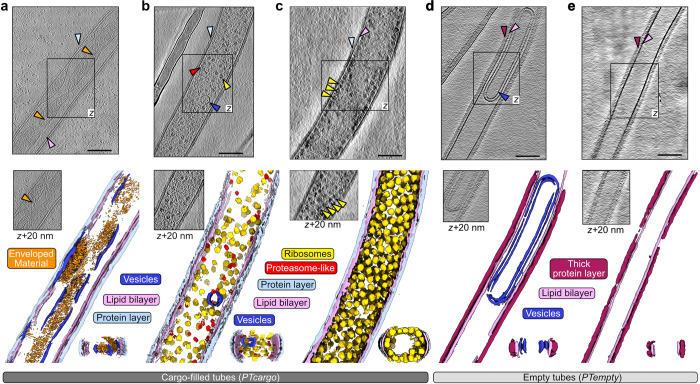
Fig 1. Ultrastructural states of the polar tubes during or after delivering cellular cargo.
(a–e) Slices through cryo-tomograms of germinated polar tubes above the respective neural network aided 3D segmentation. The central slice of a tomogram is represented at the top in each panel, as seen from the z-axis view. An additional section from the same tomogram is marked by a boxed region and shown below at axis z + 20 nm. The neural network-aided 3D segmentations corresponding to each tomogram are presented in the lower panel. Selected regions of interest in the tomogram slices, such as cellular complexes (a–c), the outer protein layer (a–e), or empty vesicles (d), are indicated with arrows colored as the labels and segmentations below. The black scale bars correspond to 100 nm.

