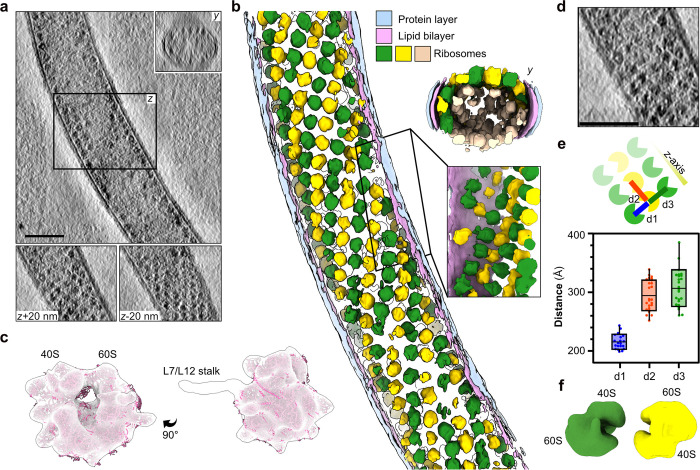
Fig 2. Spiral-like arrays of ribosomes clustering in proximity to the tube wall.
(a) Slices through a cryo-tomogram and the corresponding neural network aided 3D segmentation (b) of a polar tube filled with clustered ribosome arrays. The segmentation presents ribosomes in yellow, green, or beige. The yellow and green colored particles indicate the front view from the xy-plane, while the beige-colored particles cluster at the distal end of the same plane. The lipid bilayer is shown in pink, while the outermost protein layer is shown in blue. A y-axis view of the tomogram, as well as slices at z+20 nm and z-20 nm, are shown in the inset. A similar view along the y-axis is depicted with the segmented tube. The scale bar is 100 nm. (c) The subtomogram average of clustered particles picked from cargo-filled polar tubes. The map is lowpass filtered to at a resolution of 50 Å and is superimposed with the structure of the V. necatrix ribosome (PDB ID: 6RM3, magenta). (d) A zoomed-in view of the ribosome array packing inside the polar tube. The scale bar is 100 nm. (e) A schematic representation of panel (d) with the inter-ribosome distances (d1–d3) indicated (top) and plotted (bottom). The scatter plot depicts the average distance and distribution between particle centers measured from 3 tomograms containing ribosome spirals. Each dot represents a ribosome pair chosen for measuring the distances. The distance d1 corresponds to 2 close particles, while d2 and d3 are the more distant. The raw data underlying this figure can be found in S1 Data. (f) A subtomogram average of ribosome dimer particles is shown lowpass filtered to a resolution of 50 Å and colored as in (b).

