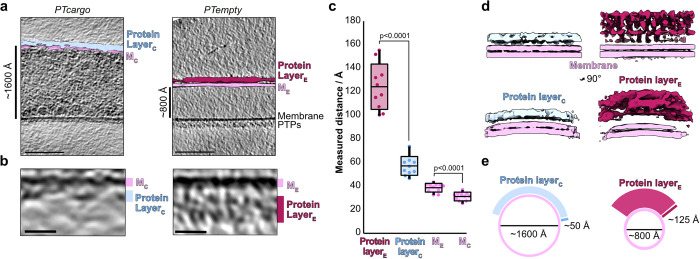
Fig 3. Visualizing polar tube wall features from cargo-filled and empty tubes.
(a) Central slices through representative cryo-tomograms from cargo-filled and empty polar tubes. Segmentations of the inner and outer layers are superimposed onto 1 side of the tube in both tomogram slices. The scale bar is 100 nm. (b) Zoomed in sections of the tube wall from (a). The scale bar is 10 nm. (c) A plot depicting the thickness of each outer protein layer and membrane bilayer, as measured across various tomograms, for cargo-filled and empty polar tubes. The p-values of two-tailed, unpaired Student’s t test analyses are shown above the compared plots. The raw data underlying this figure can be found in S1 Data. (d) Side-by-side comparison of 2 slab views of subtomogram averages obtained from cargo-filled (left) or empty (right) polar tube walls. The volumes were segmented and colored by membrane and outer layer. The views at the top (slabs along the polar tube) are shown below rotated 90° around the Y-axis (slabs across the polar tube). Map regions are colored as in (a). (e) A schematic representation of polar tube and outer protein layer remodeling during cargo movement.

