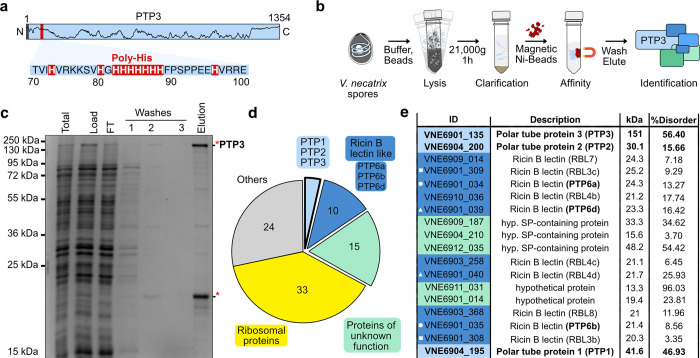
Fig 4. Endogenous PTP3 pulldown.
(a) Representation of the 1,354 amino acids long V. necatrix PTP3. Marked are the N-terminal predicted signal peptide (highlighted in gray), the histidine stretch (red area zoomed in with sequence) that was used for purification, and the disorder prediction (black line). (b) Schematic representation of the endogenous purification of PTP3. (c) The different purification steps shown in (b) have been analyzed on an SDS PAGE. See the S1 Raw Image file for the uncropped gel. The 2 bands in the “Elution” lane (indicated by the red stars) were excised for in-gel mass spectrometric analysis. (d) A pie chart showing the distribution of all mass spec hits detected in the elution sample, shown in (c), classified using functional and structural annotation of the V. necatrix genome (manuscript in preparation). (e) Mass spec hits from the classes: PTPs, RBLs, and proteins of unknown function, are sorted based on the number of significantly detected unique peptides (high to low). Gene IDs are presented with colors for the respective classes, along with names for the encoded proteins, molecular weights, and structurally disordered regions predicted using PrDos [75]. The white symbol in front of the gene ID indicates close genomic localization. The full mass spectrometry data table can be found in S2 and S3 Tables.

