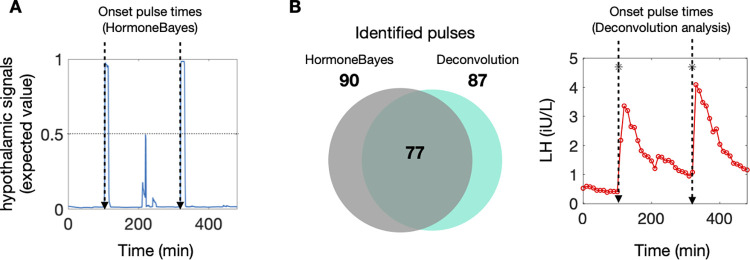
Fig 2. Pulse identification using HormoneBayes.
(A) Pulses can be identified using the expected value of the pulsatile hypothalamic signal, which can be interpreted as the probability of a pulse at a given timepoint. Here, we mark the onset of a pulse when the pulsatile hypothalamic signal crosses the 0.5 threshold, indicating that at this point a pulse is the most likely event. (B) The majority of the identified pulses (89%, 77/87) are in line with those obtained using the deconvolution method. For the analysis we used LH data obtained from healthy pre-menopausal women in early follicular phase (n = 16).

