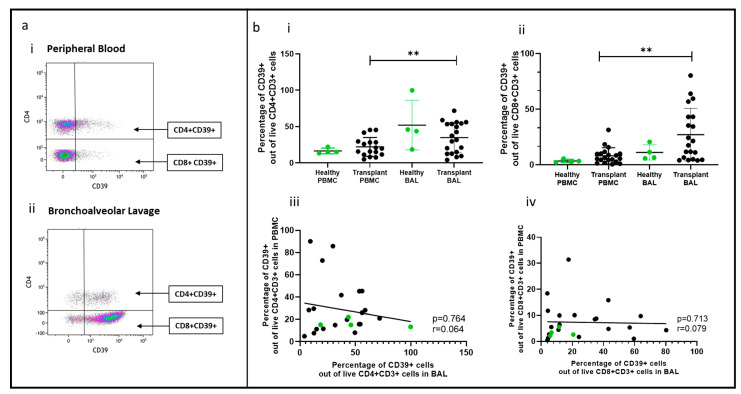
Figure 4.
Non-Tregs expressing CD39 in BAL and peripheral blood. (a) Flow cytometry plots depicting non-Treg population expressing CD39 cell populations in (i) peripheral blood and (ii) bronchoalveolar lavage. (b) (i) CD4+CD39+ T cells (ii) CD8+CD39+ T cells; (iii) cell proportions of CD4+CD39+ T cells between blood and BAL; (iv) cell proportions of CD8+CD39+ T cells between blood and BAL. ** p ≤ 0.01.

