Figure 5.
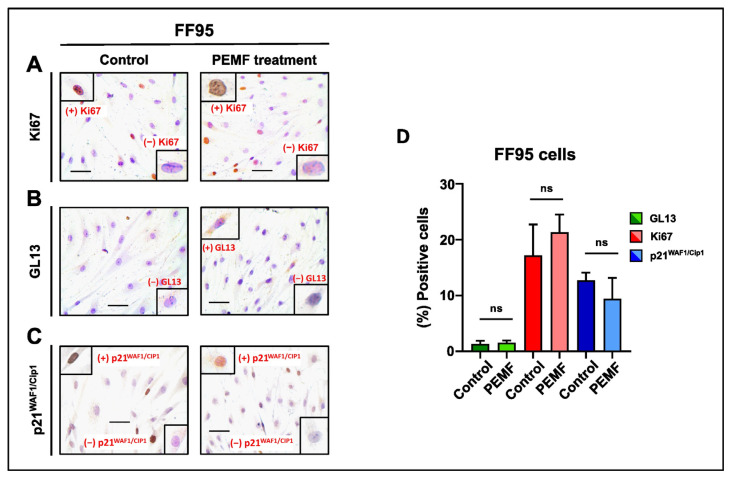
Evaluation of proliferation and cellular senescence in normal fibroblasts (FF95) following PEMF treatment. Representative images of Ki67 (A), GL13 (B) and p21WAF1/Cip1 (C) immunocytochemical staining. Ki67 and p21WAF1/Cip1 positivity was determined by evaluating the strong brown nuclear signal. GL13 staining exhibited a strong brown perinuclear and/or cytoplasmic signal. (D) Graph depicting the percentage of positive cells (%) for Ki67, GL13 and p21WAF1/Cip1 in PEMF-treated and control cells. Approximately 100 cells per optical field were counted, and ≥5 high-power fields per sample were used for the quantification. Statistical analysis was performed employing the Wilcoxon nonparametric test. The obtained data represent means ± standard deviation from four experiments. ns: non-significant. Objective 20×. Scale bar: 30 μm.

