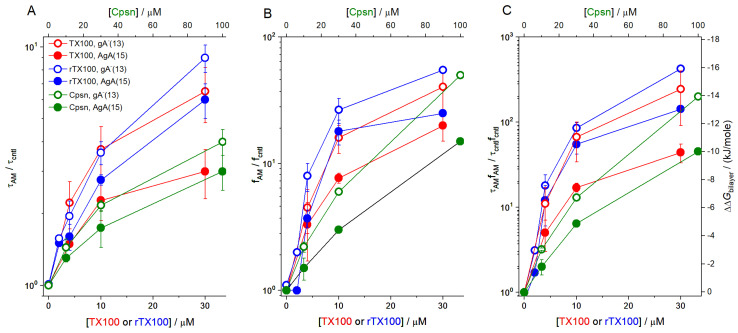
Figure 9.
Effect of TX100, rTX100 and Cpsn on the lifetimes, appearance rates, channel activities and the change in the free energies of formation (Equation (9)) of AgA(15) and gA−(13) channels. (Panel (A)) shows results for τAM/τcntl; (panel (B)) shows results for fAM/fcntl; (panel (C)) shows results for τAM·fAM/τcntl·fcntl. To facilitate comparison of the results for the 13-residue and 15-residue channels, the results are displayed using logarithmic y axes. In the control experiments for TX100, τ15 and τ13 were 160 ± 13 ms and 11.6 ± 1.4 ms, respectively; in the rTX100 experiments, τ15 and τ13 were 131 ± 7 ms and 11.0 ± 0.4 ms, respectively; in the Cpsn experiments, τ15 and τ13 were 206 ± 14 ms and 15.5 ± 0.2 ms, respectively. Filled symbols—results for AgA(15) channels; open symbols—results for gA−(13) channels. Mean ± S.D. based on at least three independent experiments, each with three or more measurements, at each condition (DOPC, 1.0 M NaCl, pH 7.0, 200 mV).

