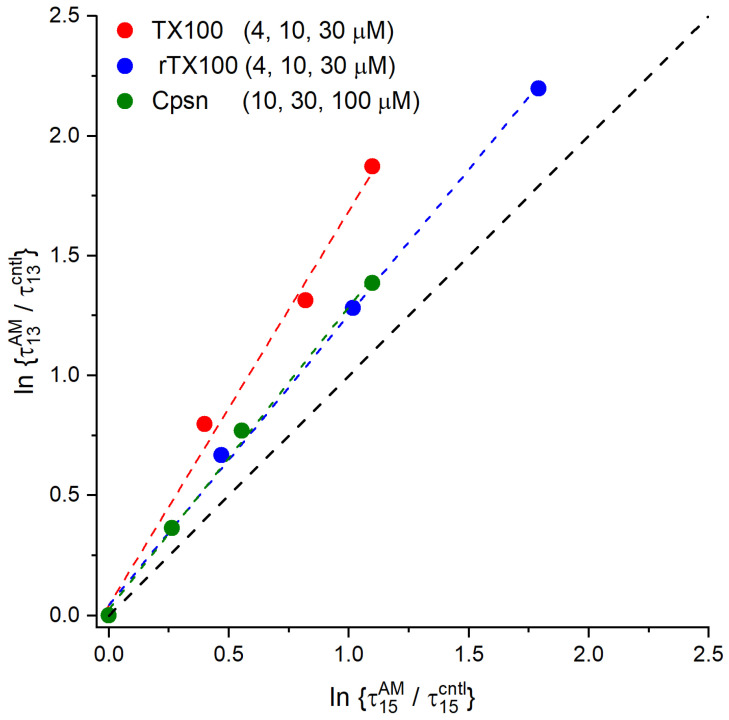
Figure 10.
Amphiphiles produce larger relative changes in the lifetimes of gA−(13) channels, , as compared to AgA(15) channels, , based on results in Figure 9. The red, blue and green dashed lines denote linear fits to the result for TX100, rTX100 and Cpsn, respectively. For TX100, the slope was 1.64 ± 0.11, r2 = 0.986 (90% confidence interval for the slope, 1.29–1.99); for rTX100, the slope was 1.21 ± 0.04, r2 = 0.997 (90% confidence interval for the slope, 1.09–1.33); for Cpsn, the slope was 1.26 ± 0.05, r2 = 0.995 (90% confidence interval for the slope, 1.10–1.42). The black interrupted line has a slope of 1. (DOPC, 1.0 M NaCl, pH 7.0, 200 mV).

