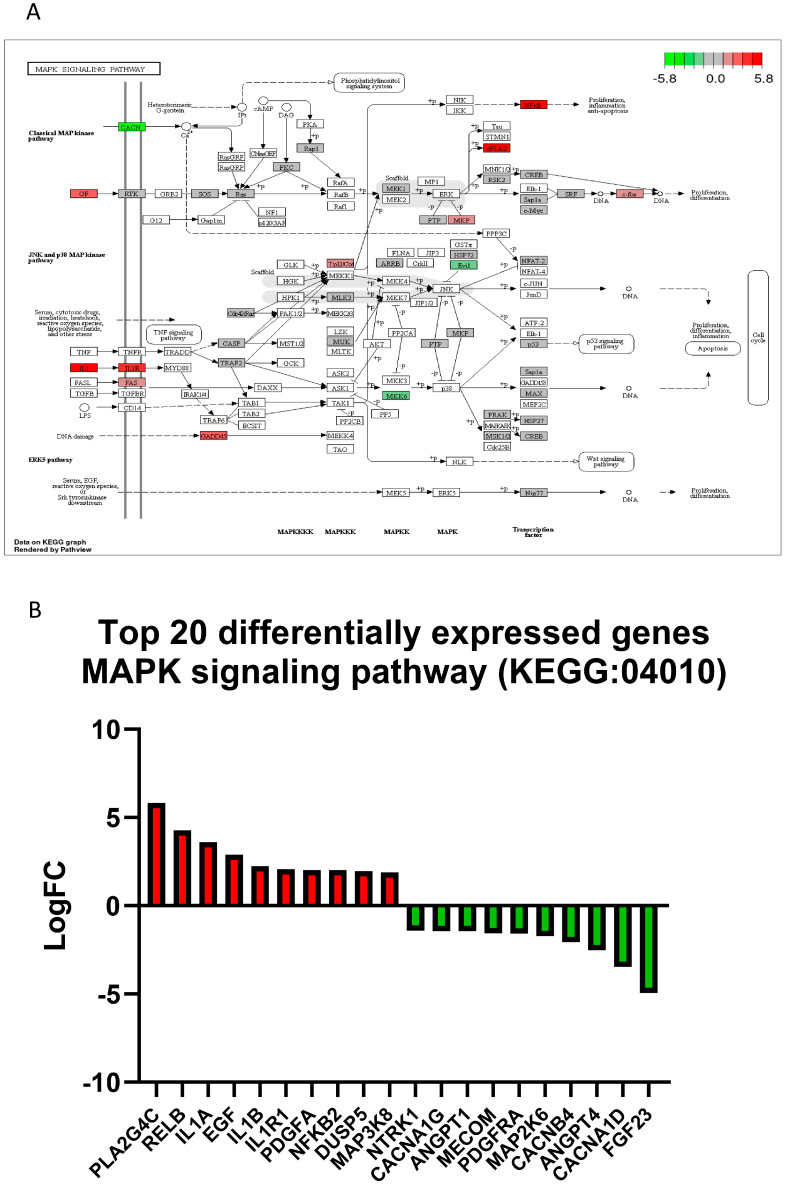
Figure 5.
TNFα treatment affects expression profiles of MAPK signaling pathway genes in human-induced pluripotent stem cells and neural stem progenitor cells (hiPSCs-NSCs/NPCs). (A) The MAPK pathway (KEGG: 04010) diagram is overlaid with the expression changes of each gene. The legend describes the values on the gradient in LogFC. Downregulated genes are shown in green, while upregulated genes are in red. (B) The top 20 differentially expressed genes in the MAPK signaling pathway (KEGG: 04010) are ranked based on their absolute value of log fold change. Upregulated genes are shown in red, and downregulated genes are shown in green. n = 5–6 sets.

