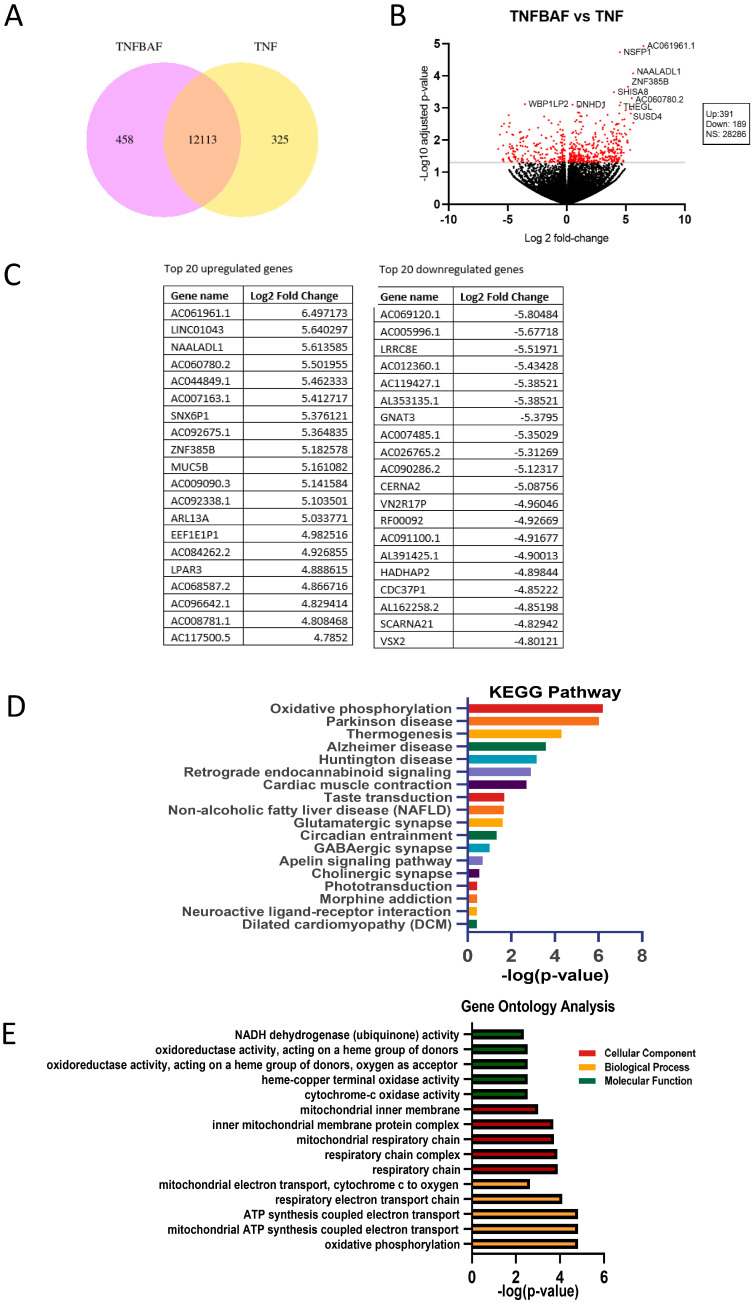
Figure 6.
RNA-seq analysis of the effect of siponimod/BAF312 on TNFα-treated human-induced pluripotent stem cells and neural stem progenitor cells (hiPSCs-NSCs/NPCs) identifies important genes involved in oxidative phosphorylation. hiPSCs-NSCs/NPCs cells were used for mRNA-Seq analysis. (A) Pie chart of TNFBAF vs. TNF showing differential gene expression under TNFα + BAF312/siponimod (TNFBAF) treatment compared with TNFα alone. (B) In the volcano plot, a total of 580 genes were significantly differentially expressed by TNFBAF (0.1 nM) and TNFα (20 ng/mL) treatment in hiPSCs-NSCs/NPCs cells, with 391 upregulated genes and 189 downregulated genes. (C) Tables show the top 20 upregulated (left) and downregulated (right) genes. (D) The 18 most significantly enriched KEGG pathways after treatment with TNFBAF and TNFα are shown. (E) Gene ontology analysis of the differentially expressed genes after siponimod treatment in hiPSCs-NSCs/NPCs cells. n = 5–6 sets.

