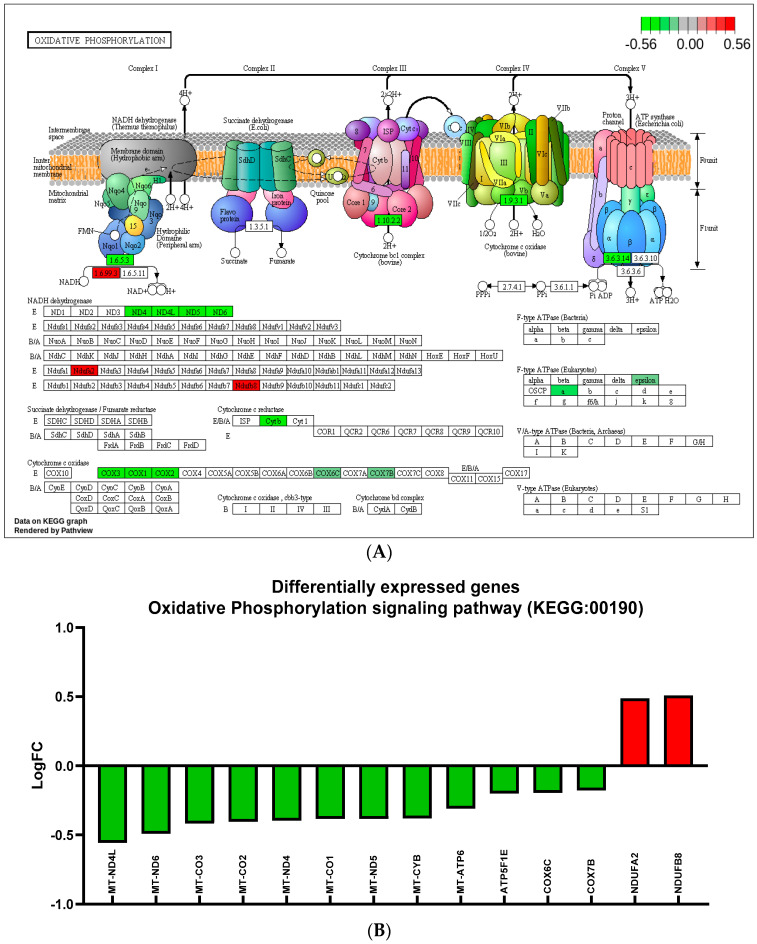
Figure 7.
Siponimod/BAF312 treatment affects the oxidative phosphorylation signaling pathway in human neuronal hiPSCs-NSCs/NPCs cells. (A) The oxidative phosphorylation pathway (KEGG: 00190) diagram is overlaid with the expression changes of each gene. Siponimod/BAF312 treatment played a crucial role in regulating oxidative phosphorylation. LogFC was used for the degree of differential expression. Downregulated genes are shown in green, while upregulated genes are in red. (B) The top differentially expressed genes in oxidative phosphorylation pathway (KEGG: 00190) are ranked based on their absolute value of log fold change. Upregulated genes are shown in red, and downregulated genes are shown in green. n = 5–6 sets.

