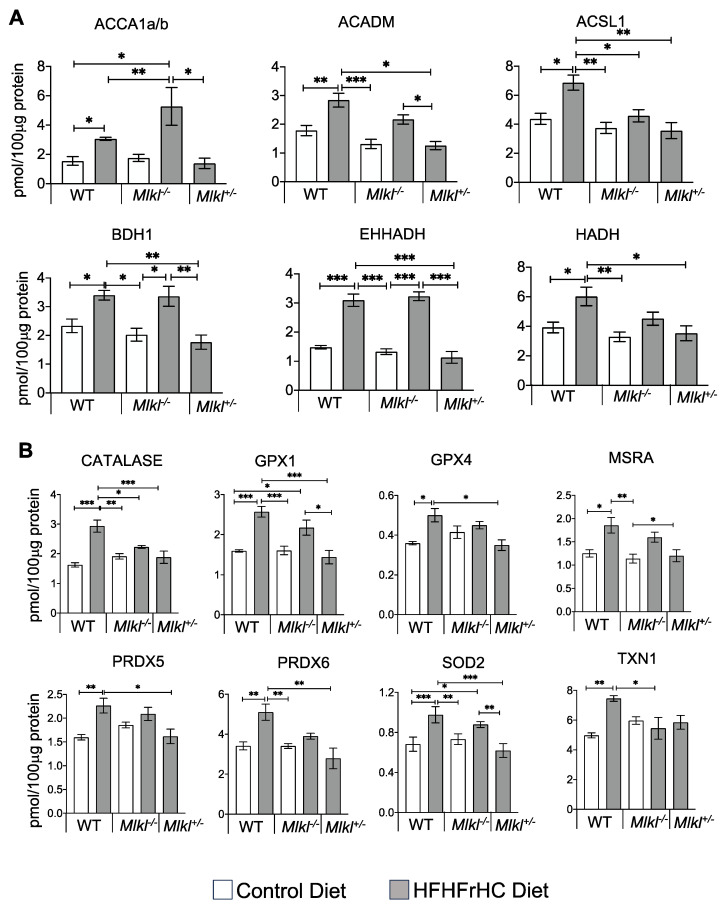
Figure 3.
Liver proteomics data. Graphical representation of enzymes involved in fatty acid oxidation (A) and proteins associated with oxidative stress (B) in the livers of WT, Mlkl−/− or Mlkl+/− mice fed a CD (white bar) or HFHFrHC diet (gray bar) (n = 5/group) measured by mass spectrometry analysis. Error bars are represented as mean ±SEM. One-way ANOVA p < 0.05, * p < 0.05, ** p < 0.005, *** p < 0.0005. ACCA1a/b: acetyl-CoA carboxylase alpha and beta, ACADM: medium-chain acyl-CoA dehydrogenase, ACSL1: acyl-CoA synthetase long-chain family member 1, BDH1: 3-hydroxybutyrate dehydrogenase 1, EHHADH: enoyl-CoA hydratase and 3-hydroxyacyl CoA dehydrogenase, HADH: 3-hydroxyacyl-CoA dehydrogenase, GPX: glutathione peroxidase, MSRA: methionine sulfoxide reductase A, PRDX: peroxiredoxin, SOD2: superoxide dismutase 2, TXN1: thioredoxin 1.

