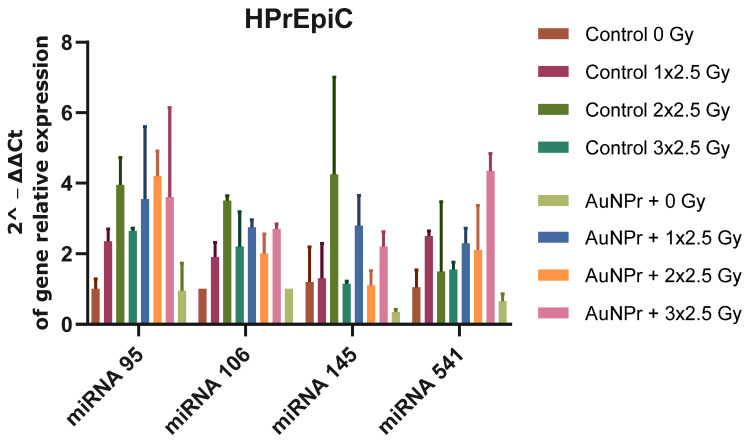
Figure 4.
Graphical representation of miRNA expression levels in the HPrEpiC cell line isolated from normal human prostate tissue. MiRNA expression was analyzed using RT-qPCR and compared to a control group that was not treated. The RNU6 housekeeping gene was used as a reference for normalization and relative expression was calculated using the ΔCT expression/ΔCT control ratio. The cells were irradiated in three doses of 2.5 Gy, with the first dose being 1 × 2.5 Gy, the second dose being 2 × 2.5 Gy, and the third dose being 3 × 2.5 Gy. N = 2.

