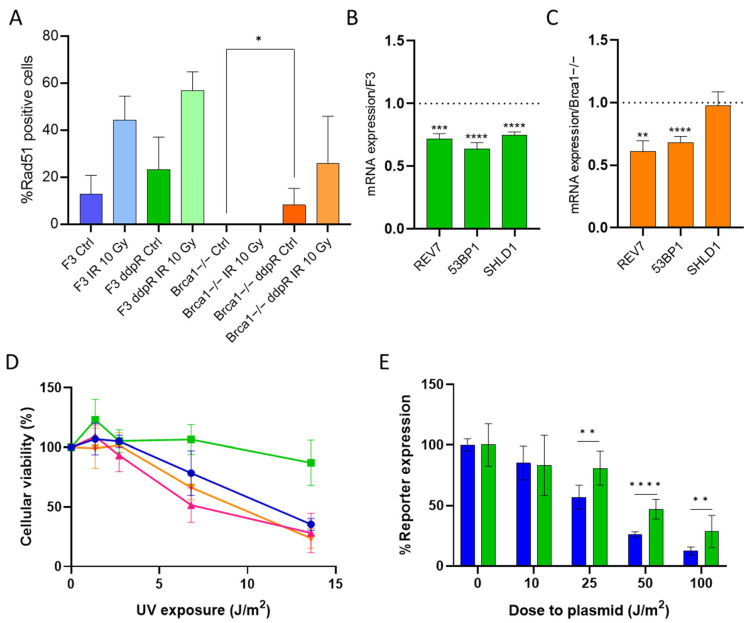
Figure 3.
DNA repair in cisplatin-sensitive and -resistant cells. (A) Percentage of Rad51 positive cells treated or not treated with IR 10 Gy, at 24 h, in DDP-sensitive and -resistant F3 and Brca1−/− cells. Rad51 foci were counted as described in Material and Methods and expressed as the mean ± SD of at least 100 nuclei in five different areas of the samples. mRNA expression levels of REV7, TP53BP1 and SHLD1 in F3 ddpR (green) (B) and Brca1−/− ddpR (orange) cells (C). Data are the mean+ SD of three independent experiments, run in triplicate and normalized on the actin gene. Data are expressed as foldchanges over the corresponding parental cell line (dotted line). (D) Dose–response curve of UV exposure in F3 (blue line), F3 ddpR (green line), Brca1−/− (pink line) and Brca1−/− ddpR cells (orange line). Data are the mean ± SD of three independent experiments, run in sestuplicate. (E) Normalized UV-damaged luciferase reporter expression after transfection in F3 (blue) and F3 ddpR (green) cells, as specified in Materials and Methods. Data are the mean ± SD of two independent experiments, run in quadruplicate. An unpaired t-test was used for statistical analyses. Only statistically significant differences are reported. * = p < 0.05; ** = p < 0.005; *** = p < 0.0005; **** = p < 0.0001.

