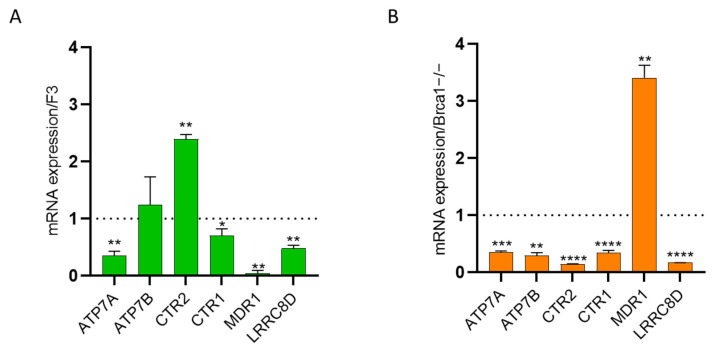
Figure 4.
mRNA levels of ATP7A, ATP7B, CTR2, CTR1, MDR1 and LRRC8D in F3 ddpR (green) (A) and Brca1−/− ddpR (orange) cells (B). Values are the mean + SD of three independent experiments, run in triplicate and normalized on the actin gene. Data are expressed as foldchange over the corresponding parental cell line (dotted line). For statistical analyses, unpaired t-test was used. Only statistically significant differences are reported. * = p < 0.05; ** = p < 0.005; *** = p < 0.0005; **** = p < 0.0001.

