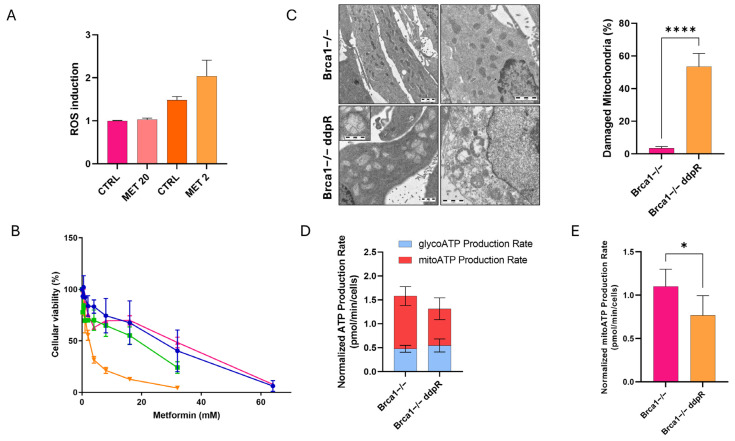
Figure 5.
Oxidative stress in ID8 Brca1−/−-sensitive and -resistant cells. (A) ROS induction in Brca1−/− (pink) and Brca1−/− ddpR (orange) cells at basal levels and after 24 h IC50 dose metformin treatment. (B) Dose–response curve of metformin in F3 (blue line), F3 ddpR (green line), Brca1−/− (pink line) and Brca1 −/− ddpR cells (orange line). Data are the mean ± SD of three independent experiments conducted in sestuplicate. (C) Transmission electron microscopy of mitochondria in Brca1−/− and Brca1−/− ddpR cells (scale bar: 1 µm), and quantification of the percentage of damaged mitochondria. (D) Normalized ATP production rate in Brca1−/− and Brca1−/− ddpR cells. (E) Mitochondrial ATP production rate in Brca1−/− and Brca1−/− ddpR cells. For statistical analyses, unpaired t-test was used. * = p < 0.05, **** = p < 0.0001.

