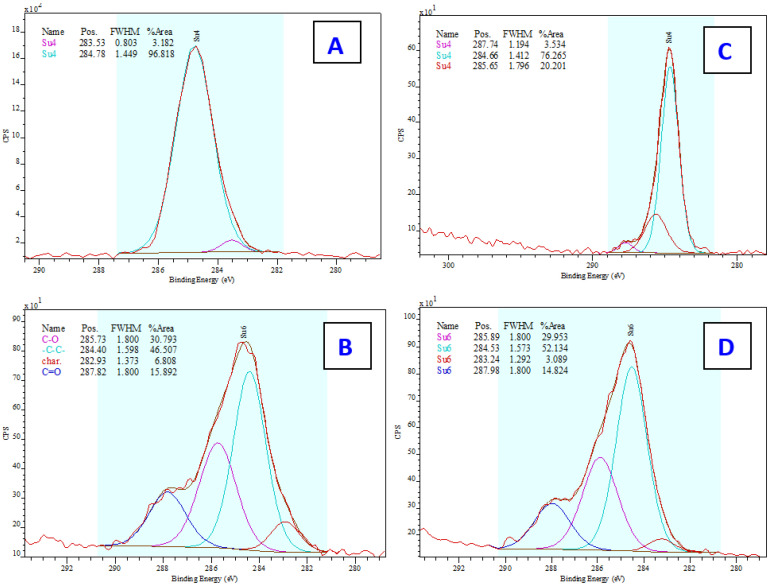
Figure 5.
Deconvoluted C1s XPS spectra of PDMS surfaces (30 × 30 μm) before lyophilization (A) and after collagen coating (B), acquired from XPS analysis, and XPS spectra of PDMS surfaces (50 × 50 μm) before lyophilization (C) and after collagen coating (D), acquired from XPS analysis. The particular description of characterictic peaks are introduced in Figure 5B, the colours corresponds on all figures (A–D) to this description. The figures show the line positions as measured, without calibration to remove drift due to charging.

