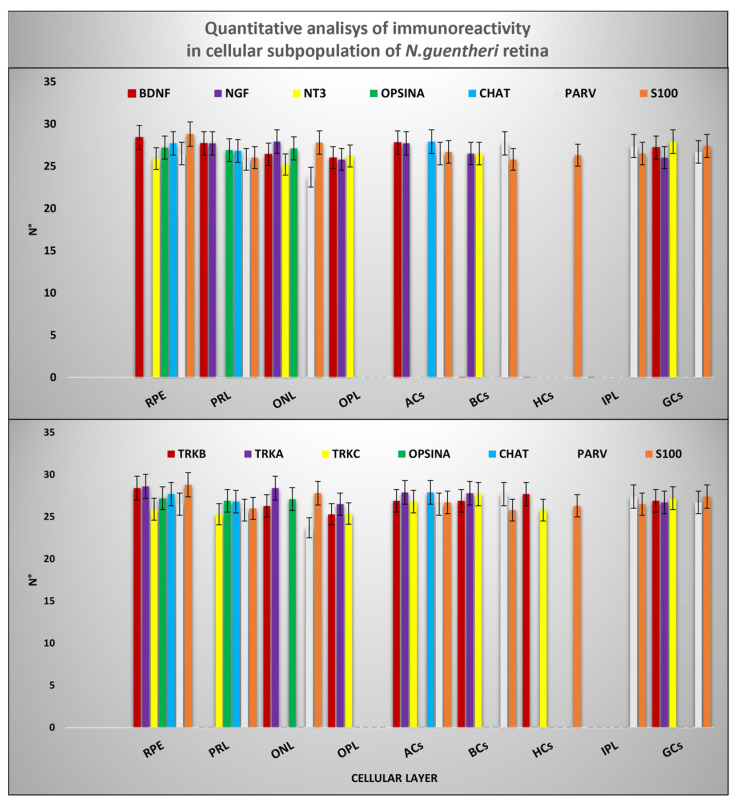
Figure 7.
Graphical representation of immunoreactivity quantitative analysis in: RPE, PRL (inner and outer segments), OPL, ACs, BCs, HCs, IPL, and GCs detected by BDNF, NGF, NT-3, TrkA, TrkB, TrkC, anti-Opsin, anti-Chat, Parvalbumin and, s100p. The statistical analysis shows a different distribution pattern of the antibodies used in this study in cellular layer of N. guentheri retina. N°: mean of retinal layer cells immunopositive to BDNF, NGF, NT-3, TrkA, TrkB, TrkC, anti-Opsin, anti-Chat, Parvalbumin and, s100p.

