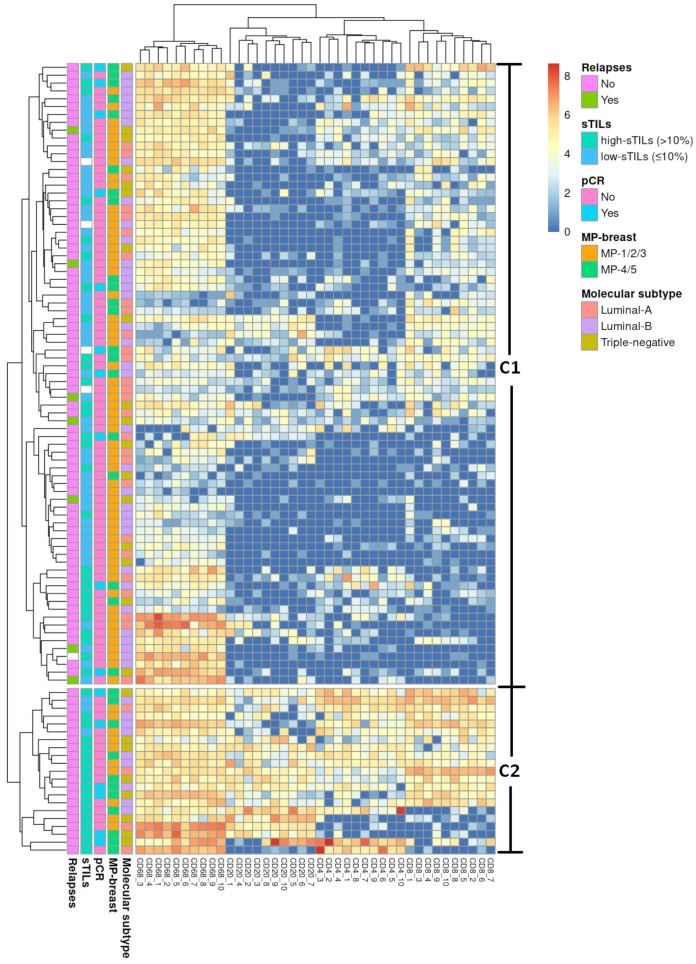
Figure 3.
Unsupervised hierarchical cluster of the entire cohort. The heat map represents the unsupervised hierarchical cluster analysis of tumour samples (rows) of the entire cohort and the relative enrichment for specific tumour-infiltrating immune cell subpopulations (CD68, CD20, CD4, and CD8) (columns). It shows two groups of patients: C1 (high risk) and C2 (low-risk).

