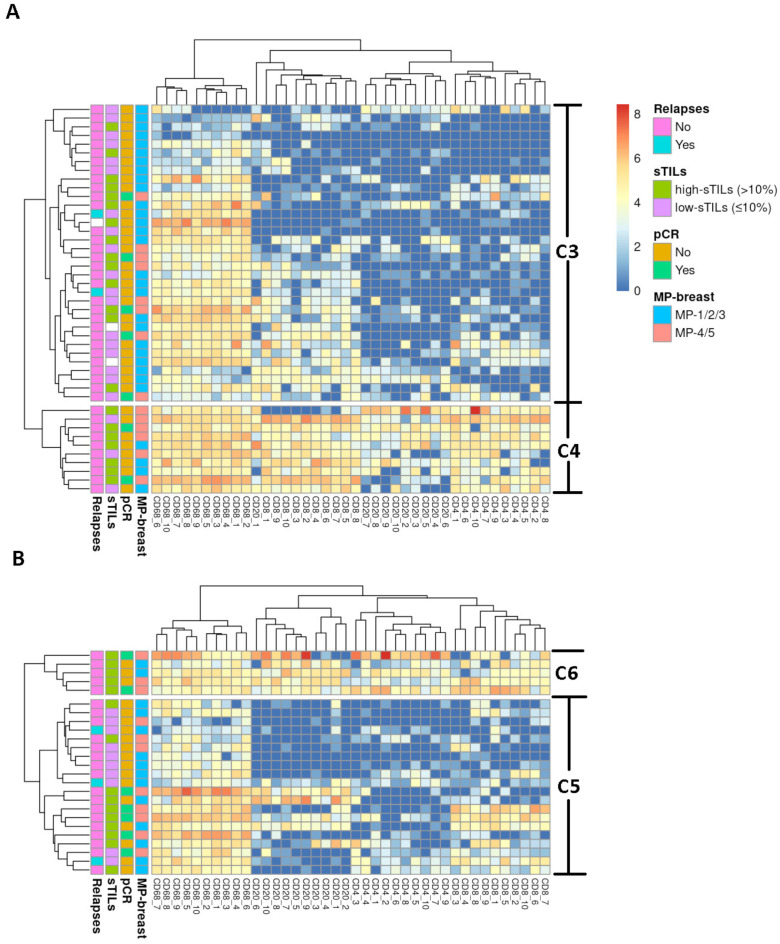
Figure 4.
Unsupervised hierarchical cluster of luminal-B and triple-negative (TN) breast cancer (BC) cases. The heat map represents the unsupervised hierarchical cluster analysis of (A) luminal-B tumour samples (rows) and the relative enrichment for specific tumour-infiltrating immune cell subpopulations (CD68, CD20, CD4, and CD8) (columns). It shows two groups of patients: C3 (high risk) and C4 (low-risk). (B) TNBC tumour samples (rows) and the relative enrichment for specific tumour-infiltrating immune cell subpopulations (CD68, CD20, CD4, and CD8) (columns). It shows two groups of patients: C5 (high risk) and C6 (low-risk).

