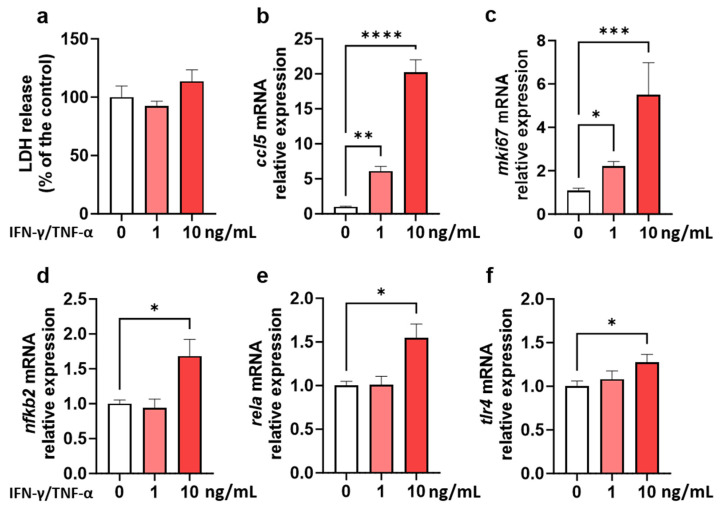
Figure 1.
EDMs response to a pro-inflammatory cytokine cocktail. LDH release (a) and mRNA relative expressions of ccl5 (b), mki67 (c), nfkb2 (d), rela (e), and tlr4 (f) genes in EDMs exposed to 0, 1, and 10 ng/mL of IFN-γ/TNF-α cocktail for 24 h. Data are presented as mean ± SEM of three independent experiments, each with four to six EDMs per group. * p < 0.05, ** p < 0.01, *** p < 0.001, and **** p < 0.0001 using a Kruskal–Wallis test followed by a post hoc Dunn’s multiple comparison test.

