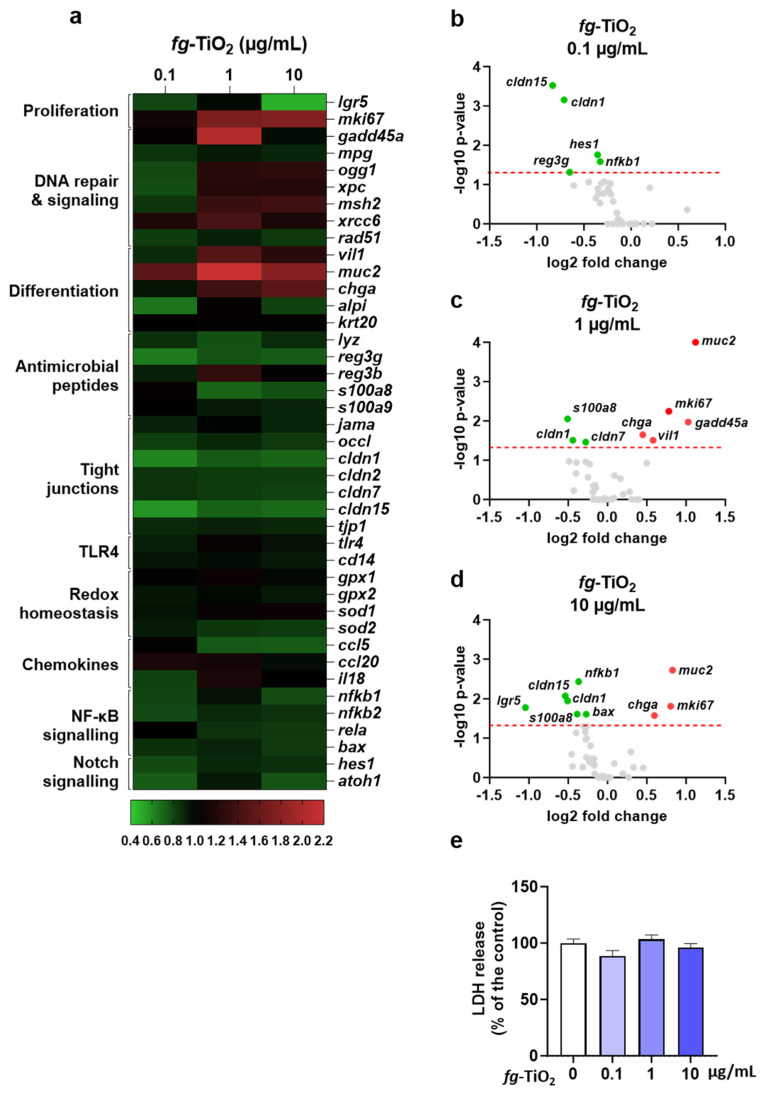
Figure 2.
Differential expression of genes involved in the maintenance of the gut barrier after exposure of EDMs to fg-TiO2. (a) Heat map showing differential gene expression in EDMs exposed for 24 h to fg-TiO2 at 0.1, 1, and 10 µg/mL, compared to control. Red and green shadings represent higher and lower relative expression levels, respectively. (b–d) Volcano plot illustrating significantly different genes expressed in EDMs exposed for 24 h to fg-TiO2 at 0.1 (b), 1 (c), and 10 (d) µg/mL. Red and green dots represent significant (p < 0.05) higher and lower relative expression levels, respectively. Grey dots represent no significant change in relative expression levels. The red dashed line shows statistical significance threshold (adjusted p-values ≤ 0.05). (e) LDH release of EDMs exposed to fg-TiO2 at 0, 0.1, 1, and 10 µg/mL, where data are presented as the mean ± SEM of three independent experiments, each with four to six EDMs per group. Note that no significant LDH release was observed (Kruskal–Wallis test followed by post hoc Dunn’s multiple comparison test).

