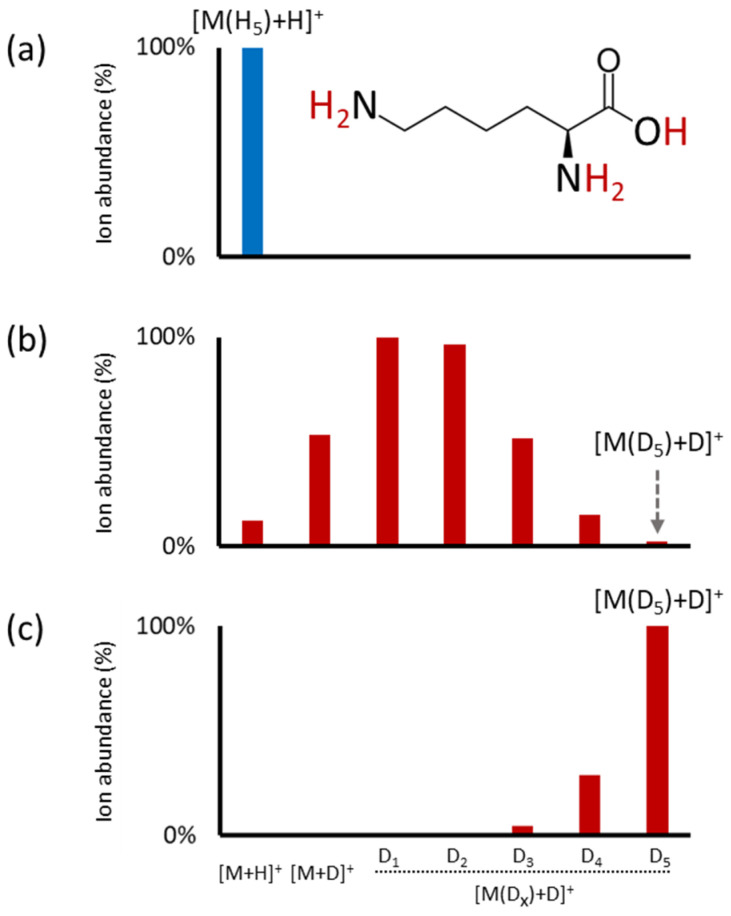
Figure 4.
MS1 spectra of amino acid lysine obtained using (a) conventional HILIC-MS (m/z 147.1128, [M+H]+), (b) conventional HILIC-MS with post-column addition of D2O (100 µL/min), and (c) full HILIC-HDX-MS (m/z 153.15046, [M(D5)+D]+). The lysine structure indicates the molecule’s possible exchangeable hydrogens (in red).

