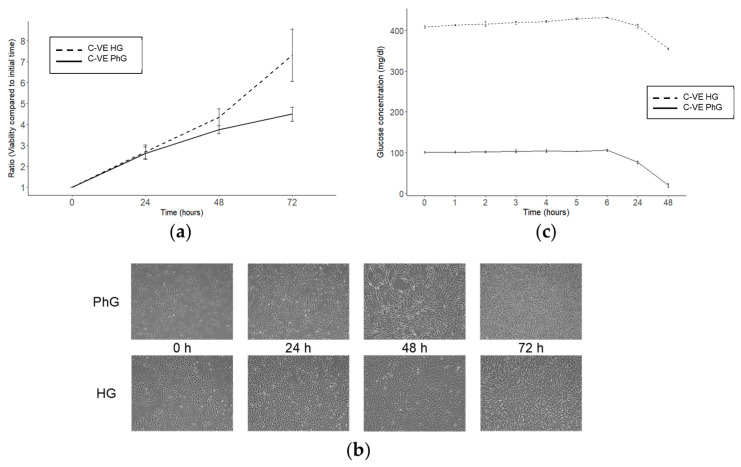
Figure 1.
Effect of glucose concentration in the hTERT RPE-1 cell culture. (a) Cell viability of the hTERT RPE-1 cell line after 72 h of cell culture and under different concentrations of glucose (N = 3). (b) Microscopy images (magnification: 50×) of hTERT RPE-1 under different glucose concentrations. (c) Glucose time course for both conditions of glucose of the cell culture supernatant (N = 3). PhG: physiological glucose; HG: high glucose; C-VE: negative control.

