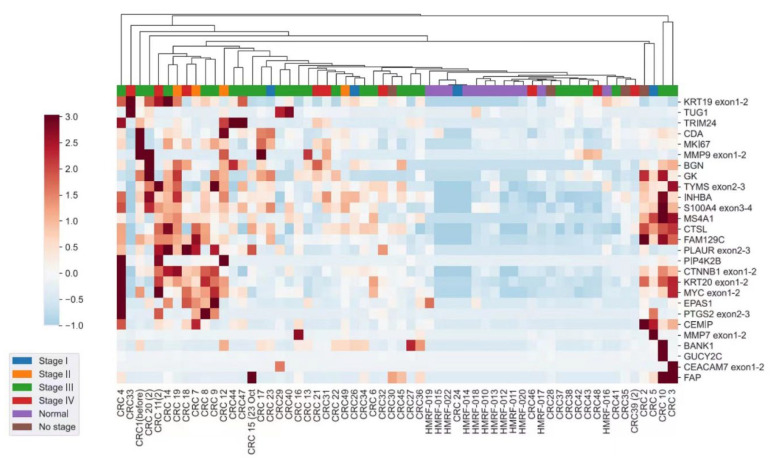
Figure 1.
Heatmap of the expression profile in CRC patients of each TNM stage independent of that of the healthy controls. The vertical axis shows the gene names and the horizontal axis shows the various TNM stages of CRC patients and healthy subjects. Hierarchical clustering was based on gene expression Z scores using the WPGMA algorithm. The red and blue colors denote high and low intensities of gene expression, respectively.

