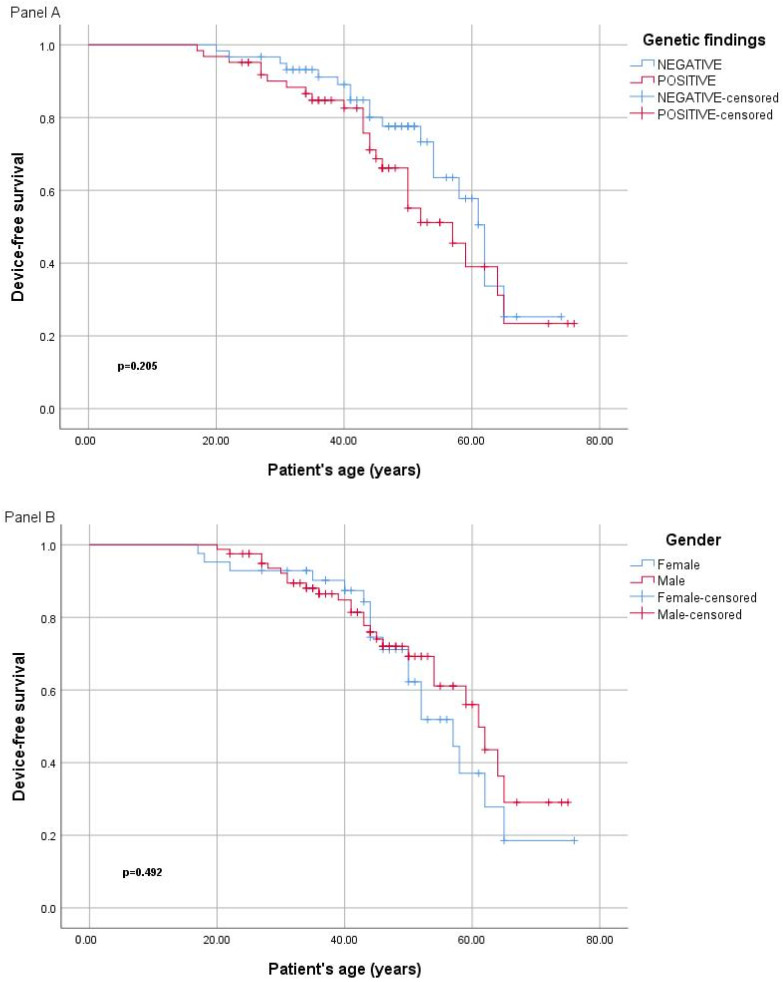
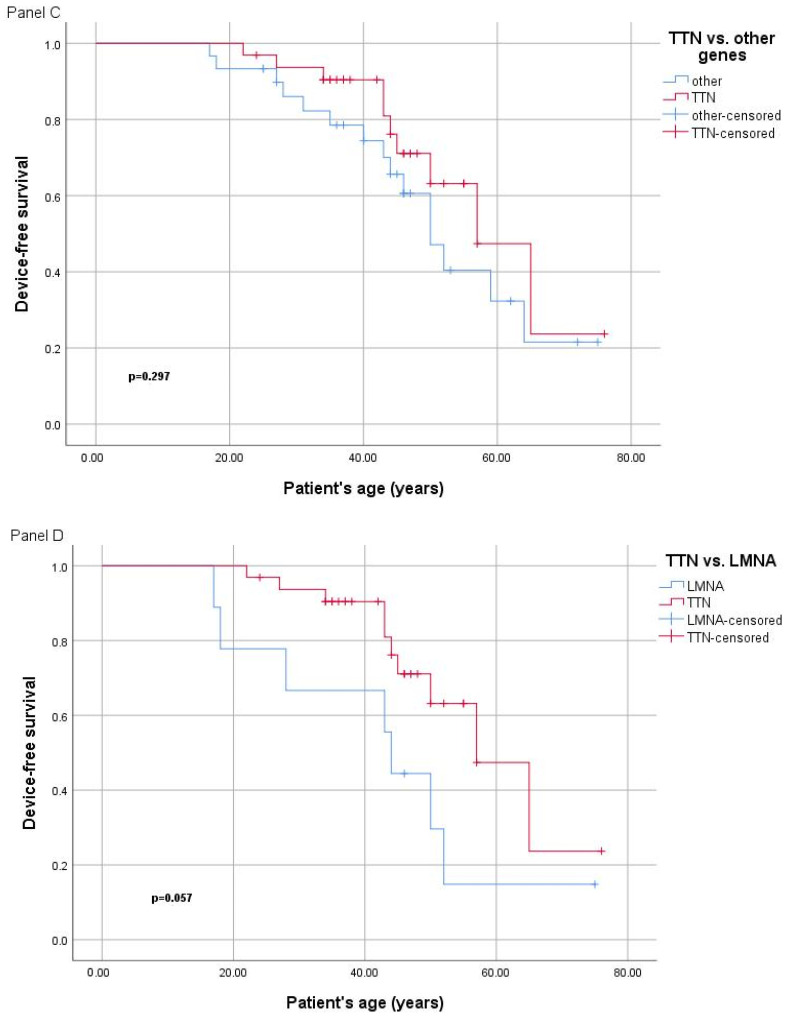
Figure 2.
(Panel A) Device free survival curves (Kaplan–Meier) in people with DCM with disease-causing variants versus those without (panel A), female versus males (panel B), those with variants in TTN versus those with findings in other genes (panel C), and those with variants in TTN versus LMNA genes (panel D).


