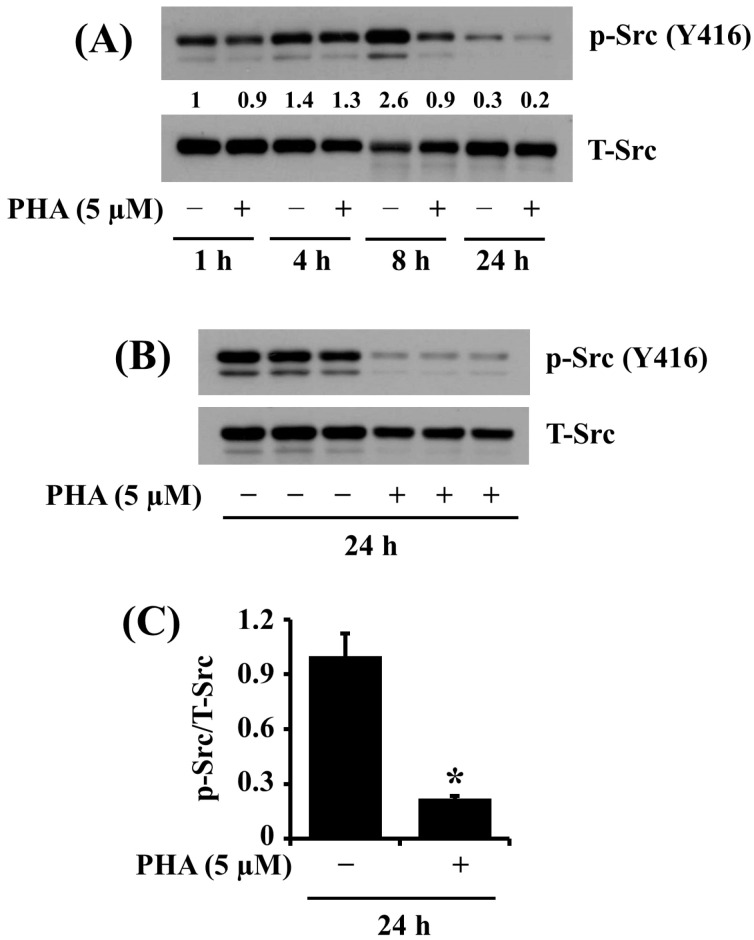
Figure 3.
Effects of PHA on the phosphorylation and expression levels of Src in HSC-3 cells. (A) HSC-3 cells were treated with vehicle control (DMSO; 0.1%) or PHA (5 μM) for the indicated times. At each time point, whole-cell lysates were prepared and analyzed by Western blotting to measure the protein expression levels of phosphorylated (p) and total (T) Src. (B) HSC-3 cells were treated with vehicle control or PHA (5 μM) for 24 h, followed by Western blotting to measure the protein expression levels of phosphorylated (p) and total (T) Src. (C) The densitometric data in (B) with the phosphorylation levels of Src normalized to total protein expression levels of Src. Data are the means ± SE of three independent experiments. * p < 0.05 compared with vehicle control.

