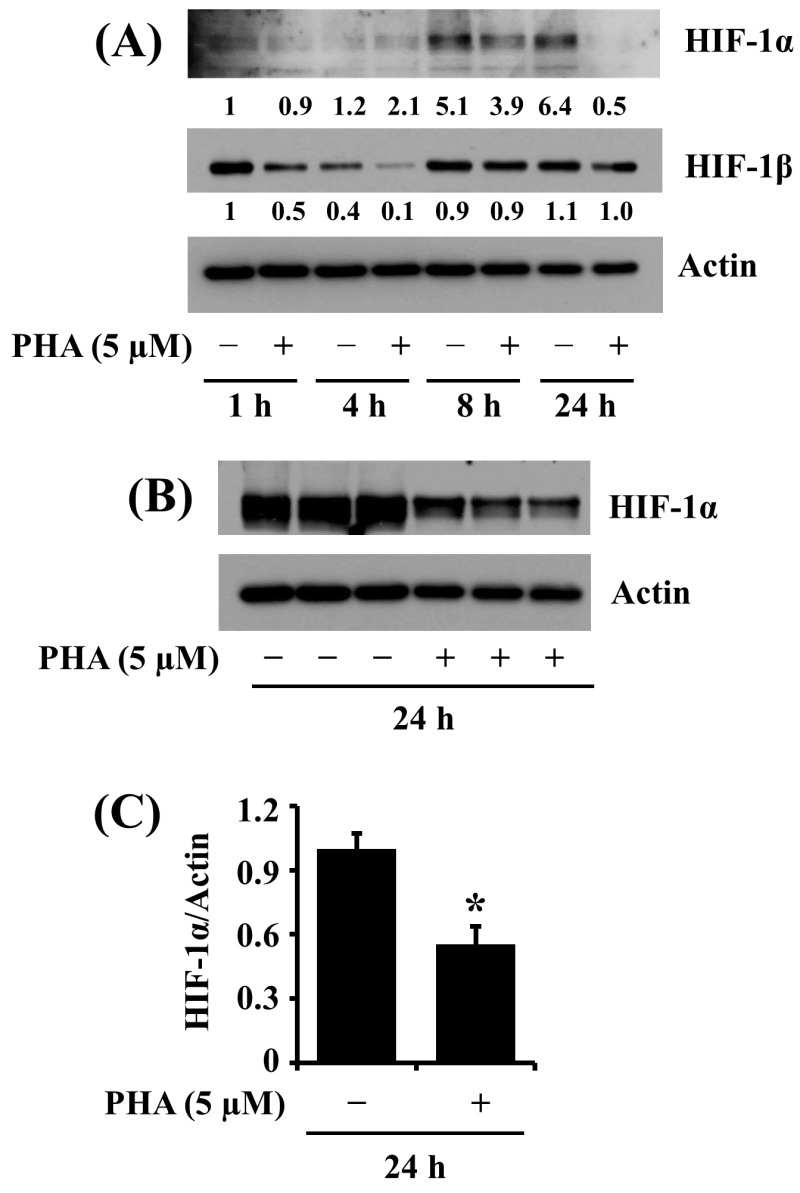
Figure 5.
Effects of PHA on the HIF-1α expression in HSC-3 cells. (A,B) HSC-3 cells were treated with vehicle control (DMSO; 0.1%) or PHA (5 μM) for the indicated times. At each time point, whole-cell lysates were analyzed by Western blotting to measure the protein expression levels of HIF-1α and HIF-1β. (B) HSC-3 cells were treated with vehicle control or PHA (5 μM) in triplicate experiments at 24 h, followed by Western blotting to measure the protein expression levels of HIF-1α. (C) The densitometric data in (B) with the protein expression levels of HIF-1α normalized to protein expression levels of actin. Data are the means ± SE of three independent experiments. * p < 0.05 compared with vehicle control.

