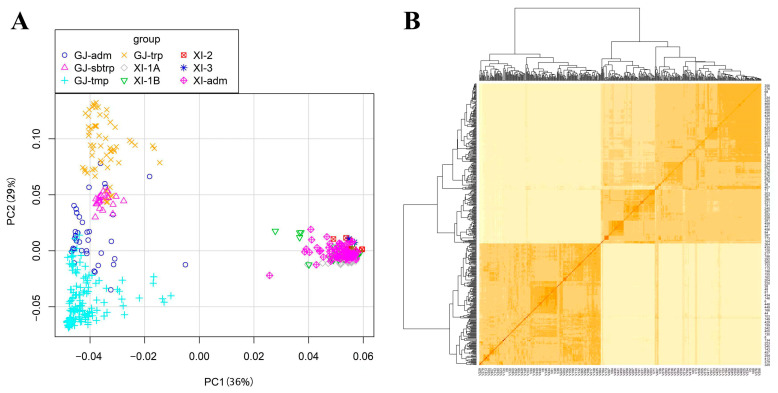
Figure 2.
The population structure and the kinship of 469 rice. (A) Principal component analysis (PCA) plots for the first two components of 469 rice accessions. Each color represents a different population: Four populations of japonica (GJ-adm, GJ-sbtrp, GJ-tmp, and GJ-trp) and five populations of indica (XI-1A, XI-1B, XI-2, XI-3, and XI-adm). (B) Kinship heat map of 469 rice. The indica subpopulation in the lower left corner and the japonica subpopulation in the upper right corner.

