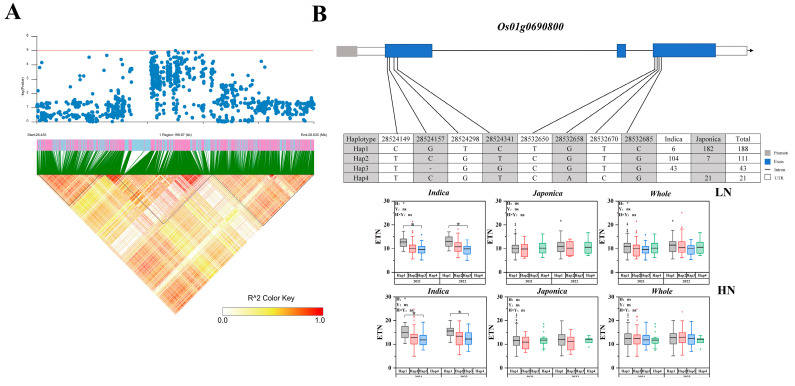
Figure 5.
Associated region and haplotype analysis of Os01g0690800. (A) Regional Manhattan plots and linkage distribution (LD) heatmap of Os01g0690800. (B) Gene structure and haplotype analysis of Os01t0690800. LD blocks indicated ± 200 kb. LN: Low nitrogen; HN: High nitrogen; ETN: Effective tillering number. The box plot describes the ETN distribution of a subgroup with a haplotype. Significant differences in two-way ANOVA (* p < 0.05, * indicates significant difference in average ETN among 469 accessions at p < 0.05, ns: no significant. H: Haplotypes, Y: Years, H × Y: Haplotypes × Years).

