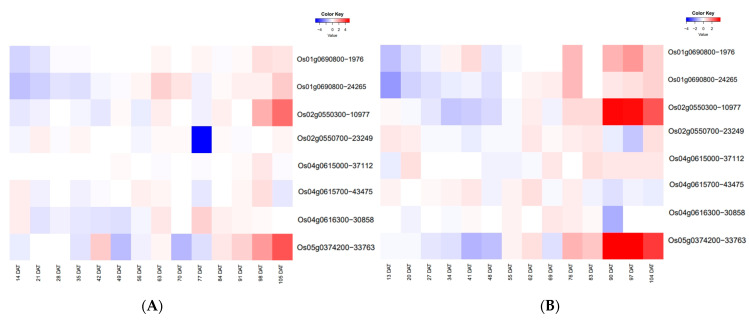
Figure 8.
Temporal expression pattern of efficient total nitrogen (ETN)-associated genes during the whole growth period. Expression data in root (A) at 12:00 and (B) 00:00 have been downloaded from the RiceXPro website (https://ricexpro.dna.affrc.go.jp/, accessed on 7 November 2022). The heatmaps represent hierarchical clustering of relative expression levels of 12 candidate genes on different days after transplanting (DAT). The scale for relative expression levels (after normalization by z-score) is denoted by color bars, with red representing high expression levels, white representing medium expression, and blue representing low expression.

