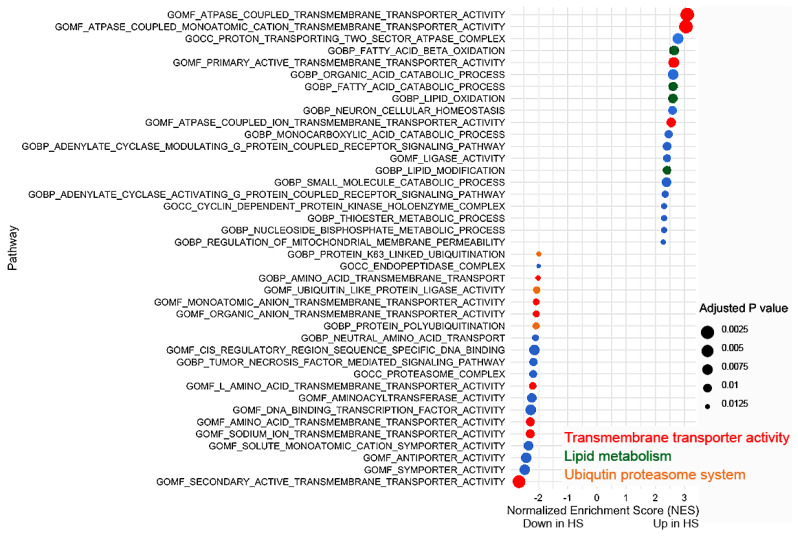
Figure 4.
GSEA of the top 20 upregulated (upper part of the gene list) and downregulated (lower part of the gene list) pathways in α-syn high seeders compared with low seeders. Red represents transmembrane transporter activity, green demonstrates lipid metabolism, orange exhibits ubiquitin proteasome system pathways, and blue indicates other pathways. Abbreviation: BP: biological process; CC: cellular component; GO: gene ontology; HS: high seeder; MF: molecular function.

